Key Highlights
- Ethereum price traded with a positive tone against the US Dollar and continued to move higher.
- There is a short-term bullish trend line formed on the hourly chart (data feed via SimpleFX) of ETH/USD, which may continue to act as a support area.
- On the upside, the pair needs to break the $11.20 level in order to gain further traction.
Ethereum price gained momentum over the weekend against the US Dollar, and it looks like further upsides are possible in the near term.
Ethereum Price Trend Line
Ethereum price ETH moved further higher against the US Dollar during the past few sessions, and my suggested idea of buying dips worked. The price broke the 100 hourly simple moving average and managed to close above it. It is a positive sign and may lift the market sentiment further in the short term.
Currently, there is a short-term bullish trend line formed on the hourly chart (data feed via SimpleFX) of ETH/USD. If the price moves down from the current levels, then the same trend line may provide support on the downside. Moreover, the 38.2% Fib retracement level of the last wave from the $10.05 low to $11.26 high might also provide bids on the downside.
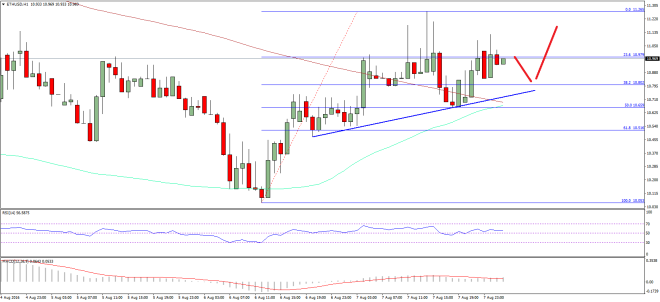

In my view, one may consider buying dips near the trend line support with a stop below the 100 hourly simple moving average or a close below the 50% Fib retracement level of the last wave from the $10.05 low to $11.26 high. If the trend line fails to provide support and the price moves down below the 100 hourly SMA, then the pair could trade back towards the $10.40 support area.
Hourly MACD – The MACD is in the bullish zone, which is a positive sign for the ETH bulls.
Hourly RSI – The RSI is also above the 50 level, suggesting that there are enough bullish signs on the chart.
Major Support Level – $10.80
Major Resistance Level – $11.20
Charts courtesy – SimpleFX