Key Highlights
- ETH price started a correction during the end of this past week versus the US Dollar.
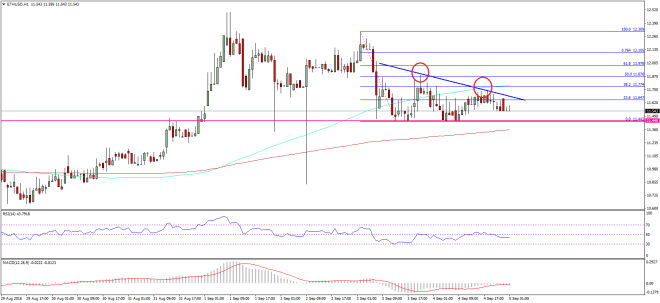
- There is a minor bearish trend line formed on the hourly chart (data feed via SimpleFX) of ETH/USD, which is currently acting as a resistance.
- The ETH/USD pair has to clear the trend line resistance in order to crawl back higher.
Ethereum price traded as low as $11.45 versus the US Dollar during the correction wave. Can it now recover and move back higher?
Ethereum Price Gains
Ethereum price ETH after a solid bounce this past week started a correction against the US Dollar and traded as low as $11.45. There was a buying interest noted around the stated level, as the buyers managed to prevent the downside. The ETH is currently consolidating in a minor range and preparing for the next move. On the upside, an initial resistance is around the 23.6% Fib retracement level of the last drop from the $12.30 high to $11.44 low.
However, the most important hurdle is around a minor bearish trend line formed on the hourly chart (data feed via SimpleFX) of ETH/USD. The highlighted trend line may act as a pivot zone for the pair in the short term. If the bulls manage to break it, then a test of the 100 hourly simple moving average is possible. Moreover, any further upside could take the pair towards the 61.8% Fib retracement level of the last drop from the $12.30 high to $11.44 low.

On the downside, a break below $11.45 may push the price towards the $11.20 level. In my view, as long as the price is above $11.45, it may attempt to bounce once again.
Hourly MACD – The MACD is slightly in the bearish zone, but no strong selling signal.
Hourly RSI – The RSI is below the 50 level, which is not good for the bulls.
Major Support Level – $11.45
Major Resistance Level – $11.80
Charts courtesy – SimpleFX