

Key Highlights
- ETH price traded lower, but it succeeded in holding a major support at $362-364 against the US Dollar.
- There is a short-term bearish trend line forming with resistance at $385 on the hourly chart of ETH/USD (data feed via Kraken).
- The pair has to move above the $385 level and the 100 hourly simple moving average for more gains.
Ethereum price is trading above key levels against the US Dollar and Bitcoin. ETH/USD has to surpass the 100 hourly SMA and $385 to move higher.
Ethereum Price Resistance
There were mostly negative moves in ETH price below the $400 level against the US Dollar. The price traded lower, but the best thing was the fact that it stayed above the $362-364 support. The recent low was formed at $364.32 before the price started a consolidation. It is currently trading above the $364 level, but there are many hurdles on the upside.
At the moment, the price is struggling to break the 38.2% Fib retracement level of the last decline from the $418 high to $365 low. However, the main hurdle is the $385 level and the 100 hourly simple moving average. A break and close above the 100 hourly SMA is needed for a push towards $400. An intermediate resistance is around the 50% Fib retracement level of the last decline from the $418 high to $365 low. Once the price succeeds in breaking the $385 and $391 resistances, it could move above the $400 level.
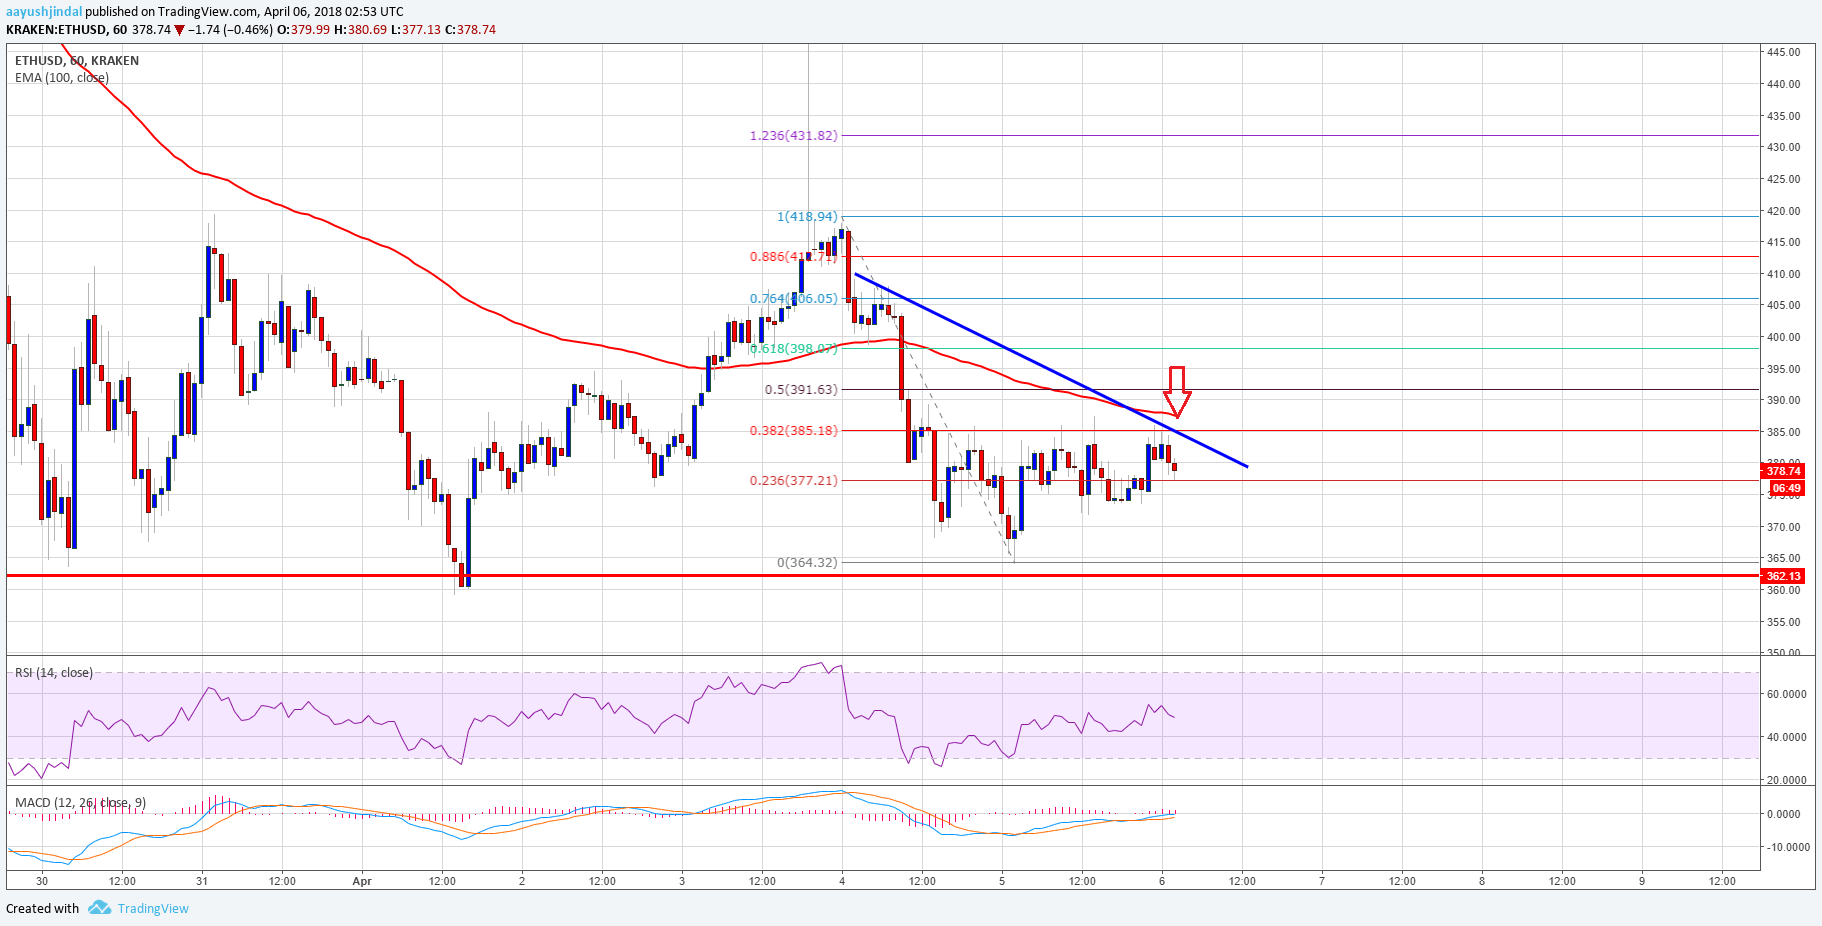

On the downside, the price has to stay above the $362 and $364 support levels. If buyers fail to protect losses above $362, there could be a decline towards $350. In the short-term, there could be ranging moves with chances of an upside break above the $385 level.
Hourly MACD – The MACD is slightly placed in the bullish zone.
Hourly RSI – The RSI is just below the 50 level.
Major Support Level – $362
Major Resistance Level – $385
Charts courtesy – Trading View