

Key Highlights
- ETH price is correcting lower from the $478 swing high against the US Dollar, but it remains supported.
- There is a key contracting triangle forming with resistance near $478-480 on the hourly chart of ETH/USD (data feed via SimpleFX).
- The pair has to stay above the $450 support and the 100 hourly simple moving average to move back higher.
Ethereum price is correcting lower against the US Dollar and Bitcoin. ETH/USD has to stay above $440-450 and the 100 hourly SMA to remain in the bullish zone.
Ethereum Price Resistance
There was a decent price action in ETH price above $440 against the US Dollar. The price remained in the bullish zone and it recently traded as high as $478.05 before initiating a downside correction. It is important to note that the price faced a major connecting resistance trend line at $478 that prevented further gains. During the decline, the downside move found support near $440 and the 100 hourly simple moving average.
There was once a close below $448-450 and the 100 hourly SMA. However, the price moved back in the bullish zone above $448-450 and also settled above the 100 hourly SMA. It seems like there is a key contracting triangle forming with resistance near $478-480 on the hourly chart of ETH/USD. The pair is currently above the 38.2% Fib retracement level of the last drop from the $478.05 high to $441.65 low.
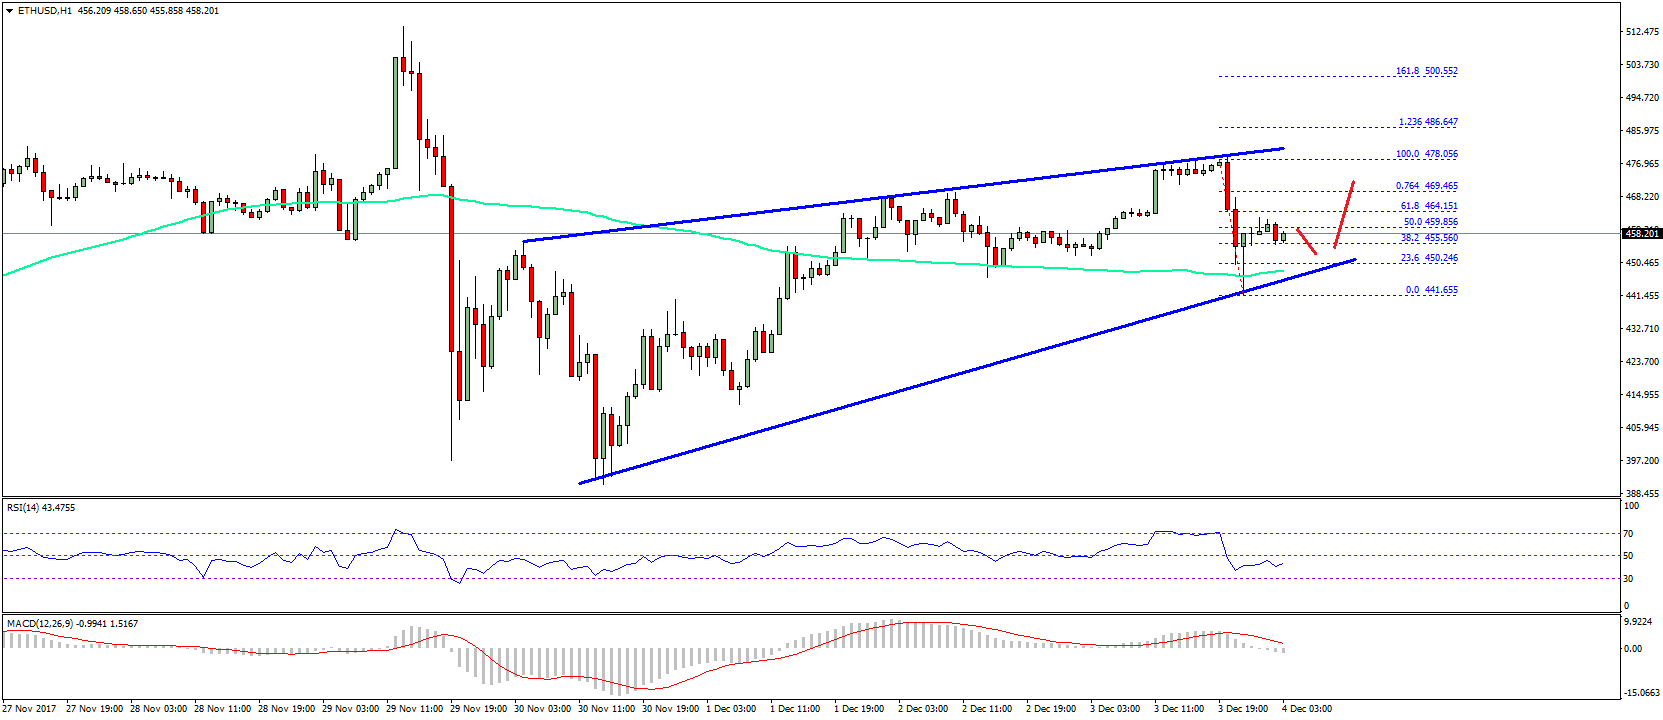
However, the price is struggling to gain traction above $460-465. Moreover, the 50% Fib retracement level of the last drop from the $478.05 high to $441.65 low is acting as a resistance. Overall, the trend is positive as long as the price is above $440 and the 100 hourly SMA.
Hourly MACD – The MACD is about to move back in the bearish zone.
Hourly RSI – The RSI is currently well below the 50 level and is showing a few bearish signs.
Major Support Level – $440
Major Resistance Level – $478
Charts courtesy – SimpleFX