

Key Highlights
- ETH price is trading near a major support at $495-500 against the US Dollar with positive signs.
- There is an important bullish trend line forming with support at $500 on the hourly chart of ETH/USD (data feed via Kraken).
- The pair must stay above the $495 support and the 100 hourly simple moving average to continue higher.
Ethereum price is holding gains against the US Dollar and Bitcoin. ETH/USD is currently above $500 and is eyeing an upside break in the near term.
Ethereum Price Trend
There was a minor downside reaction in ETH price after it made a new monthly high at $538.34 against the US Dollar. The price declined and traded below the $525 support to test the $500 zone. During the decline, there was a break below the 50% Fib retracement level of the last leg from the $481 low to $538 high. However, the downside move was protected by the $500 support zone and the 100 hourly simple moving average.
Moreover, there is also an important bullish trend line forming with support at $500 on the hourly chart of ETH/USD. The trend line support at $500 and 100 hourly SMA are strong supports on the downside. At the moment, the price is trading near the 23.6% Fib retracement level of the last decline from the $538 high to $497 low. To initiate a fresh upside wave, buyers need to break the $515-517 resistance area. The stated $517 level is the 50% Fib retracement level of the last decline from the $538 high to $497 low. A successful push above the $517 level will most likely take the price towards $540 in the near term.
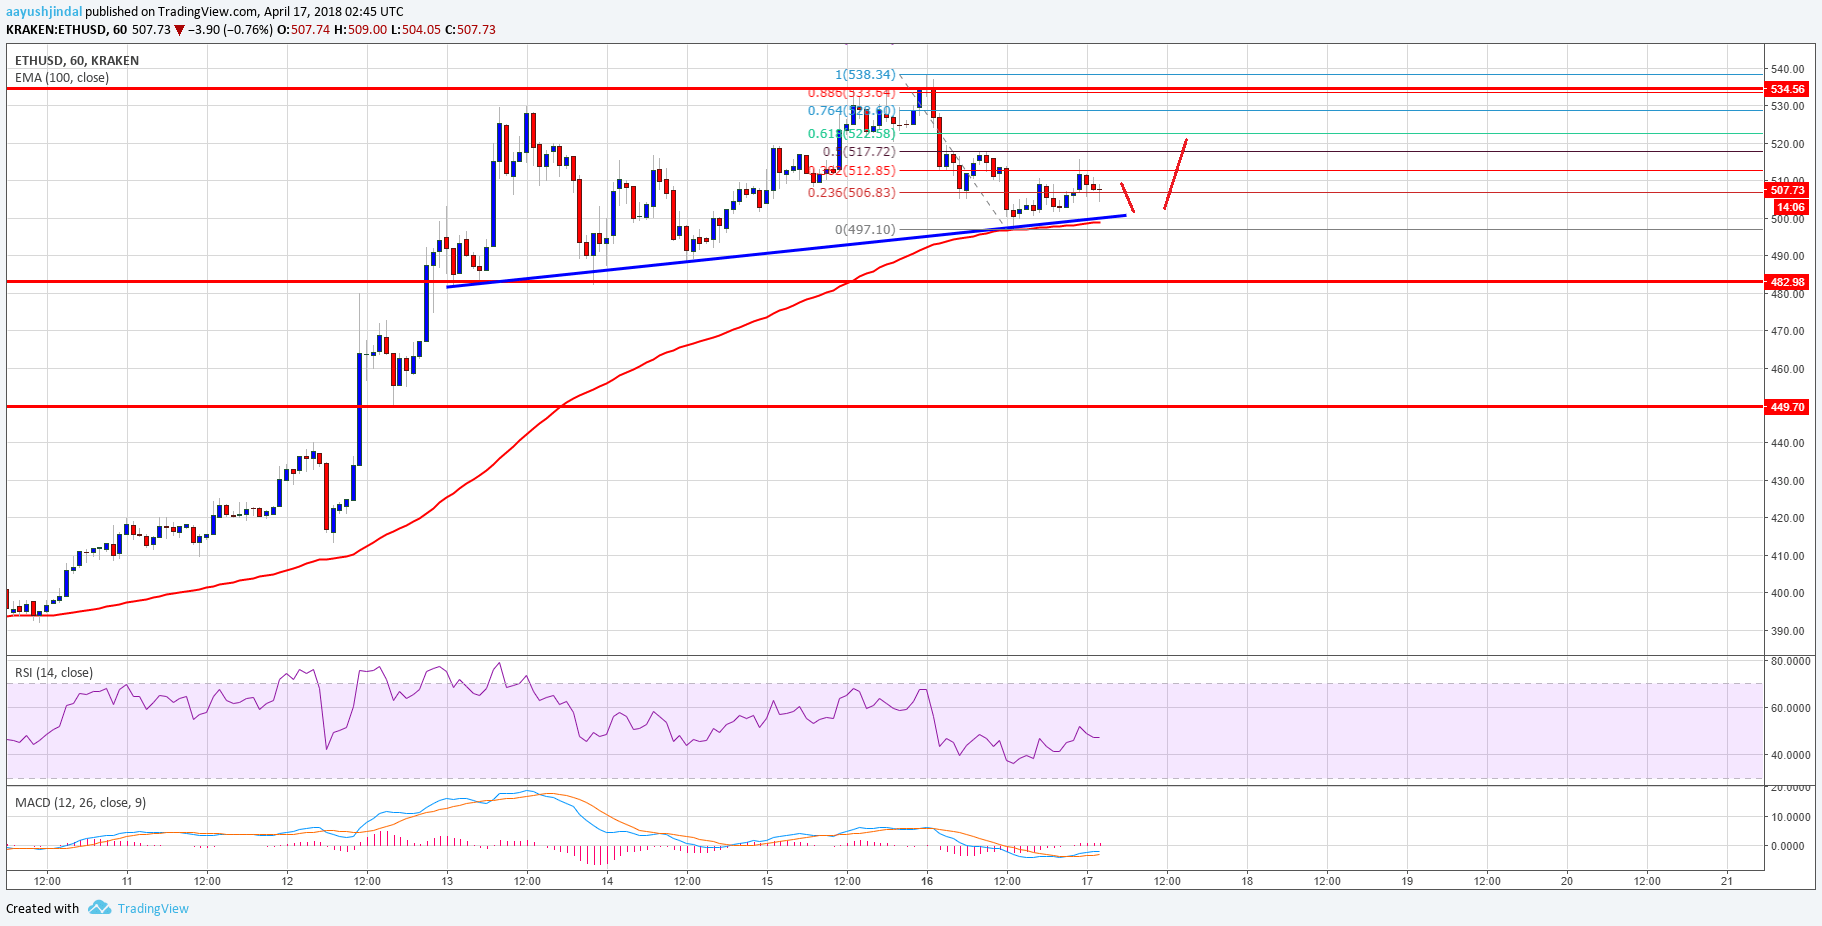

Looking at the chart, there are many positive signs since the price is holding the $500 level and the 100 hourly SMA. A break below 100 hourly SMA may perhaps drag the price towards $480.
Hourly MACD – The MACD is slowly moving in the bullish zone.
Hourly RSI – The RSI is currently just below the 50 level.
Major Support Level – $500
Major Resistance Level – $517