Key Highlights
- ETH price is correcting lower, but it is holding the $900 support area against the US Dollar.
- There is a short-term bearish trend line forming with resistance at $920 on the hourly chart of ETH/USD (data feed via SimpleFX).
- The pair is now below the 100 hourly simple moving average and $950, which are likely to act as resistances.
Ethereum price is moving lower further against the US Dollar and Bitcoin. ETH/USD has to hold the $900 support level to remain in a bullish trend.
Ethereum Price Support
There was a nice upside move above $940 this past week in ETH price against the US Dollar. The price traded above the $950 level, but it could not test the $1,000 level. A high was formed at $970 from where a downside correction was initiated. It moved down and broke the 38.2% Fib retracement level of the last wave from the $868 low to $970 high.
There was also a break below the $925 support and the 100 hourly simple moving average. However, the downside move was protected by the $900 support. A low was formed at $895 and the price started an upside correction. It traded above the 23.6% Fib retracement level of the last decline from the $970 high to $895 low. However, the price failed to gain upside momentum above the $930 level and the 100 hourly SMA. It failed to break the 50% Fib retracement level of the last decline from the $970 high to $895 low.
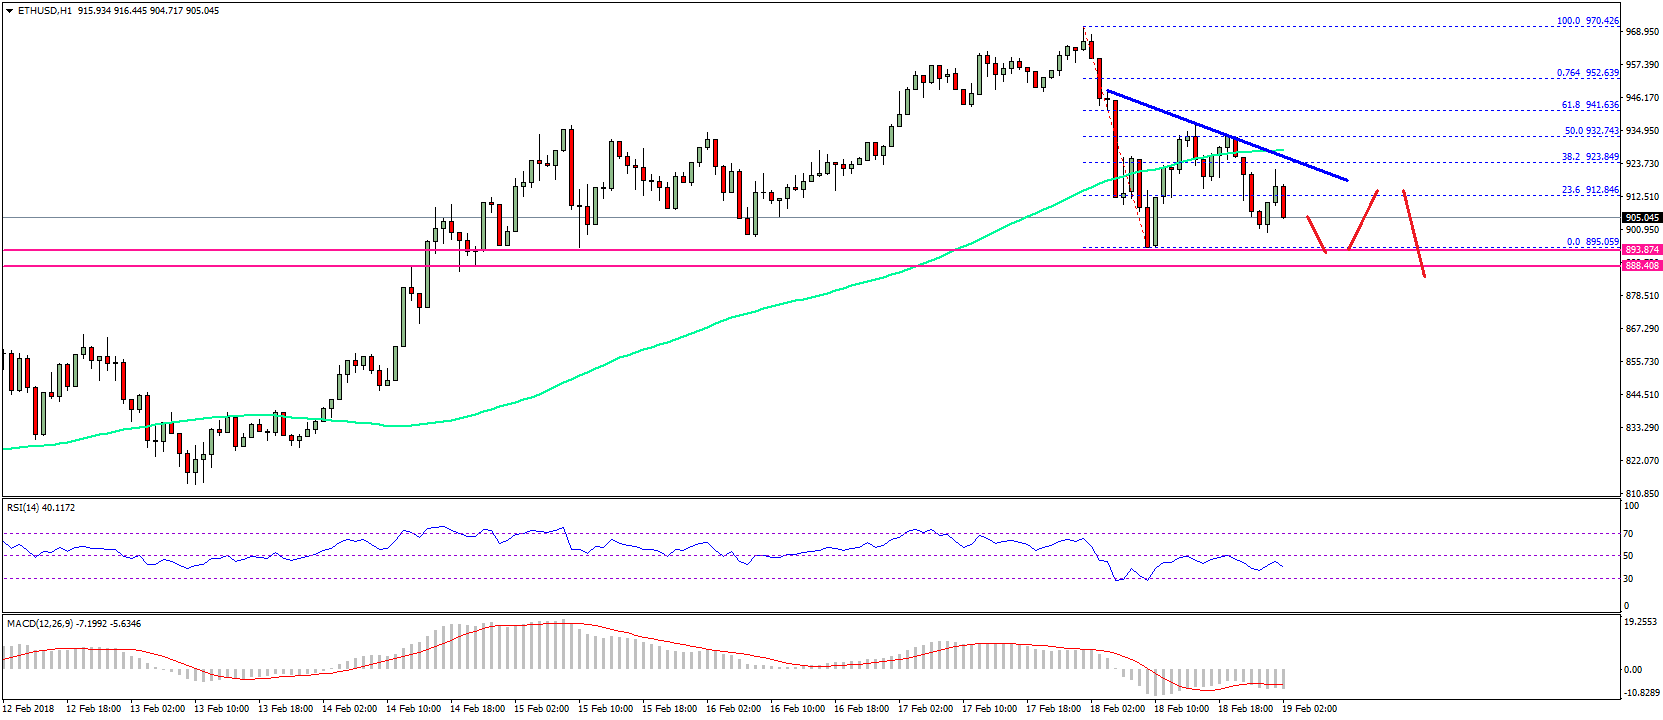

On the upside, there is a short-term bearish trend line forming with resistance at $920 on the hourly chart of ETH/USD. As long as the pair is below the trend line, $930 and 100 hourly SMA, it could continue to struggle.
Hourly MACD – The MACD has moved into the bearish zone.
Hourly RSI – The RSI is now well below the 50 level and is showing bearish signs.
Major Support Level – $900
Major Resistance Level – $930
Charts courtesy – SimpleFX