Key Highlights
- ETH price remained in a tiny range above $195 against the US Dollar with no major sign of an upside break.
- Yesterday’s short-term contracting triangle pattern with current resistance at $202 on the hourly chart of ETH/USD (data feed via SimpleFX) is still intact.
- On the upside, the 100 hourly simple moving average at $208 might act as a major hurdle.
Ethereum price is trading in a range against the US Dollar and Bitcoin, and now ETH/USD is facing a crucial upside barrier near $208.
Ethereum Price Resistance
There was almost no action in ETH price as it continued to trade in a range below $205-201 against the US Dollar. The price after trading as low as $190.30 started correcting higher. However, there was no major bullish momentum and the price mostly consolidated near $200.00. Yesterday’s short-term contracting triangle pattern with current resistance at $202 on the hourly chart of ETH/USD is playing well. There was a move above the 23.6% Fib retracement level of the last decline from the $236.16 high to $190.30 low.
However, ETH buyers failed to gain momentum above $205-210. There is a major bearish trend line forming on the same chart near $211. The 100 hourly simple moving average is also positioned near $208. Moreover, the 38.2% Fib retracement level of the last decline from the $236.16 high to $190.30 low is at $207.80. All in all, there are a series of resistances on the upside starting with $202 up to $211. Only a convincing break above 100 hourly simple moving average at $208 could lead for more gains.
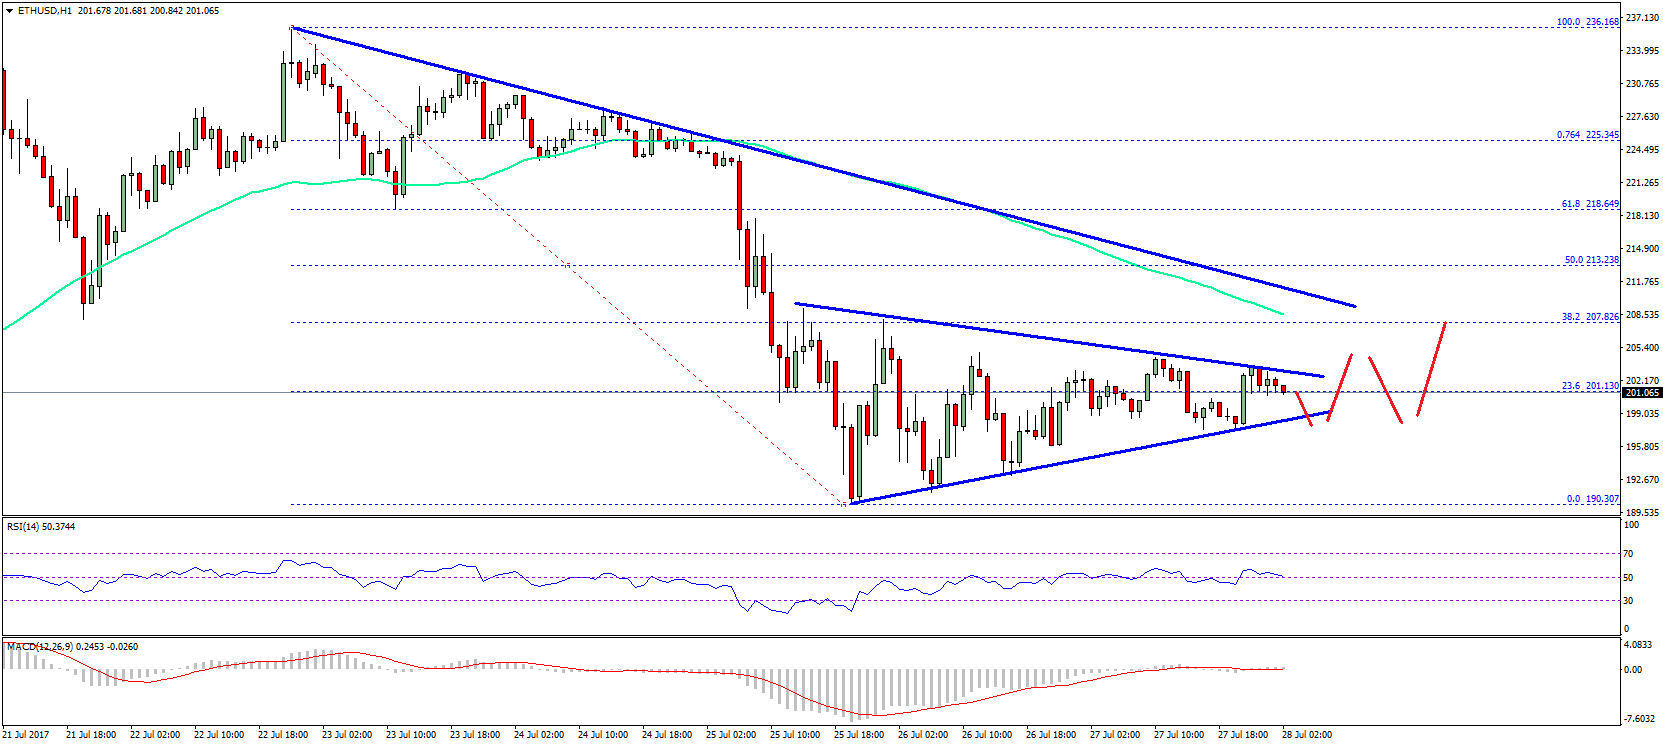
On the downside, the triangle support is at $198.00. A break below it or $190.30 would ignite further bearish pressures in the near term.
Hourly MACD – The MACD is mostly flat in the bullish zone.
Hourly RSI – The RSI is above the 50 level, but struggling to gain momentum.
Major Support Level – $198
Major Resistance Level – $208
Charts courtesy – SimpleFX