Key Highlights
- Ethereum price enjoyed a decent upside move against the US Dollar, and broke a major resistance area.
- This past week’s highlighted bearish trend line on the hourly chart (data feed via Kraken) of ETH/USD was broken to open the doors for more gains.
- The price is currently consolidating in a range, and may be setting up for the next move.
Ethereum price gained bids this past week against the US Dollar, and might be preparing for more upsides moving ahead.
Ethereum Price Range
Ethereum price ETH managed to trade a few points higher this past week against the US dollar and moved above the $10.20 level. The most important point is the fact that buyers broke this past week’s highlighted bearish trend line on the hourly chart (data feed via Kraken) of ETH/USD. The price traded as high as $11.30 where it found sellers and started correcting lower.
A couple of other important points to note include that the price is now above the 100 hourly simple moving average, which is a positive sign. If the ETH/USD pair continues to correct, then it can find bids near the 38.2% Fib retracement level of the last leg from the $9.14 low to $11.30 high.
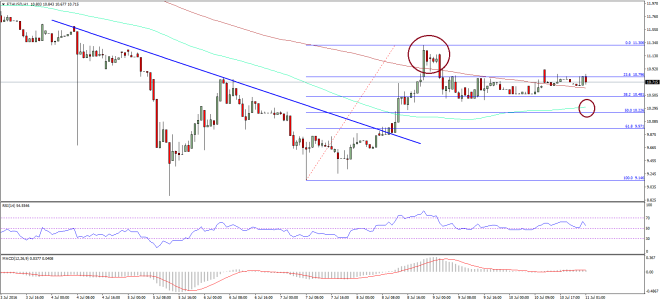

I think the price is currently consolidating losses, and may be setting up for the next move. The chances of an upside move are more in my opinion looking at the current technical indicators. As long as the price is above the 100 hourly SMA, it may rise once again. On the downside, the most important support after the 100 SMA is the 50% Fib retracement level of the last leg from the $9.14 low to $11.30 high.
Hourly MACD – The MACD is in the bullish zone, which is a bullish sign.
Hourly RSI – The RSI is above the 50 level, calling for more gains.
Major Support Level – $10.40
Major Resistance Level – $11.30
Charts courtesy – SimpleFX