Key Highlights
- ETH after struggling to clear a major resistance area against the US Dollar moved down.
- There is a chance that the ETH/USD pair is forming a double top pattern on the hourly chart (data feed via SimpleFX).
- If the current trend remains intact, there is a possibility of a test of the 100 hourly simple moving average.
Ethereum price ETH might have made a short-term top against the US Dollar, and may correct lower in the near term.
Ethereum Price Correction
Ethereum price ETH tested the $12.65 level a couple of times against the US Dollar during the past few sessions, but failed to break it. The ETH bulls failed to break the stated resistance area, and as a result there was a downside move. Yesterday’s highlighted short-term bullish trend line on the hourly chart (data feed via SimpleFX) of ETH/USD was also broken during the downside move.
Moreover, the price closed below the 38.2% Fib retracement level of the last leg from the $10.85 low to $12.66 high. So, there is a chance of an extension of the current correction. One important point to note is that the price may be forming a double top pattern around $12.65. There were two rejections around the stated level, so there can be a move towards $11.50.
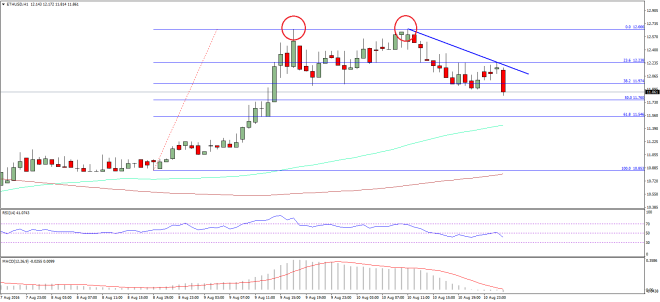

If the price continues to correct lower, then a test of the 61.8% Fib retracement level of the last leg from the $10.85 low to $12.66 high is possible, which is at $11.54. The stated level holds a lot of importance, as the 100 hourly simple moving average is positioned just below it. All in all, the price may correct further, but remains supported on the downside.
Hourly MACD – The MACD is about to change the slope to the bearish zone, calling for more downsides.
Hourly RSI – The RSI also moved below the neutral level.
Major Support Level – $11.50
Major Resistance Level – $12.20
Charts courtesy – SimpleFX