
Key Highlights
- ETH price found buyers near $11.50 against the US Dollar, and started to move higher.
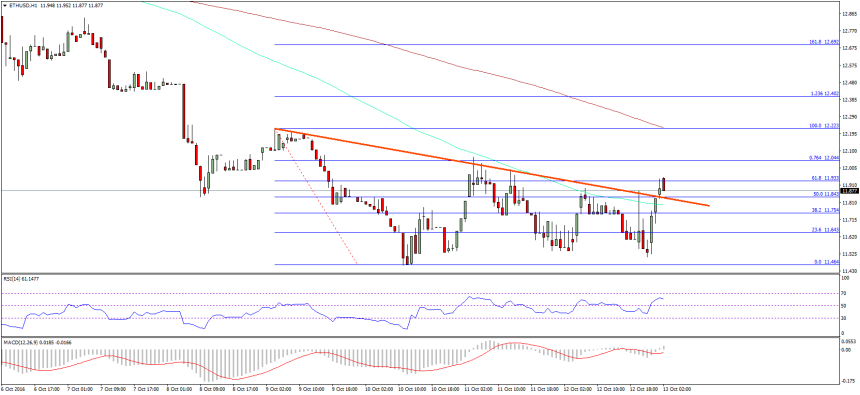
- During the recent upside move, it broke a bearish trend line formed on the hourly chart (data feed via SimpleFX) of ETH/USD.
- The pair is also above the 100 hourly simple moving average, which is a positive sign.
Ethereum price managed to gain bids one more time against the US Dollar, and currently attempting yet another upside break.
Ethereum Price Break
Ethereum price fell yesterday back towards the $11.50 versus the US Dollar, but somehow buyers managed to protect the downside move. There was a nice upside move in ETH/USD, taking it above the 23.6% Fib retracement level of the last drop from the $12.22 high to $11.46 low. It was a positive sign, which encouraged the buyers to take the price above the 100 hourly simple moving average.
There was a move above a couple of important hurdles as well. First, the ETH/USD pair managed to break a bearish trend line formed on the hourly chart (data feed via SimpleFX). Second, there was a move above the 50% Fib retracement level of the last drop from the $12.22 high to $11.46 low. These signs show that the recent upside move in ETH was encouraging,
We need to see whether the buyers can manage to hold the gains or not. If they manage to break the $12.00 resistance, it would open the doors for more gains in the near term. On the downside, the broken 100 hourly simple moving average may now act as a support. Any further losses may call for a retest of the last swing low of $11.50.
Hourly MACD – The MACD has moved from the bearish to bullish zone, which is a positive sign.
Hourly RSI – The RSI is also above the 50 level, calling for further upsides.
Major Support Level – $11.65
Major Resistance Level – $12.00
Charts courtesy – SimpleFX