Key Highlights
- ETH price remained above a major support area versus the US Dollar and currently positioning for a break.
- Yesterday’s highlighted bearish trend line on the hourly chart (data feed via SimpleFX) of ETH/USD is still in play and may provide us the next break.
- On the downside, the $11.45-50 support holds the key and must prevent a downside move.
Ethereum price managed to stay in a positive zone against the US Dollar, and it looks like we can witness a break in ETH/USD moving ahead.
Ethereum Price Support
Ethereum price ETH yesterday managed to hold the ground versus the US Dollar, as the $11.45-50 support area prevented a downside. The stated support holds a lot of importance, and it looks like it won’t be easy for sellers to break it. However, on the flip side, there is a major resistance on the upside as well. Yesterday’s highlighted bearish trend line on the hourly chart (data feed via SimpleFX) of ETH/USD is a crucial hurdle.
The price is stuck between a major support and a bearish trend line. The ETH bulls need to clear the trend line resistance along with the 23.6% Fib retracement level of the last drop from the $12.30 high to $11.44 low for more gains. If they succeed, then there is a high possibility of a break of the 100 hourly simple moving average.
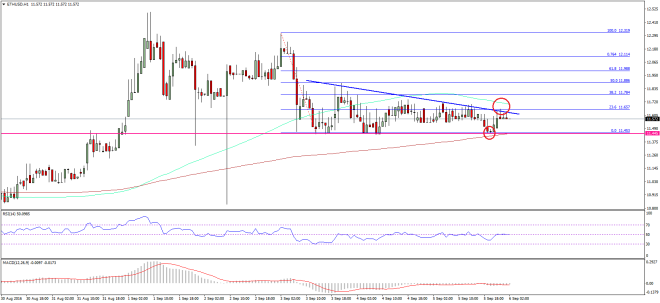

In my view, as long as the price is above the $11.40 level, it may move back higher. The next resistance on the upside could be at 61.8% Fib retracement level of the last drop from the $12.30 high to $11.44 low. If at all, there is a break of $11.40, then a move towards $11.00 is possible.
Hourly MACD – The MACD is slightly in the bearish zone, but may move in the bullish zone soon.
Hourly RSI – The RSI is just around the 50 level, and waiting for buyers to gain control.
Major Support Level – $11.45
Major Resistance Level – $11.65
Charts courtesy – SimpleFX