

Key Highlights
- Ethereum price after collapsing this past week vs the US Dollar started to recover.
- The ETH bulls are currently attempting to clear a bearish trend line formed on the hourly chart (data feed via Kraken) of ETH/USD, which is acting as a resistance.
- The price is now above the 100 hourly simple moving average, which is a positive sign.
Ethereum price this week past week weakened, but it looks like ETH/USD found support near an important support of $10.20-00.
Ethereum Price Recovery
Ethereum price ETH started to decline this past week vs the US Dollar and traded as low as $10.29 where the ETH bulls just managed to find bids. A recovery started over the weekend, and there was a minor upside move, which pushed the price above the 38.2% Fib retracement level of the last drop from the $14.40 high to $10.29 low. However, the price is currently trading near a bearish trend line formed on the hourly chart (data feed via Kraken) of ETH/USD, which is acting as a barrier for more gains.
One positive sign for the ETH bulls is the fact that the price is above the 100 hourly simple moving average. So, if they manage to break the trend line and resistance area, then a move towards the 61.8% Fib retracement level of the last drop from the $14.40 high to $10.29 low is possible.
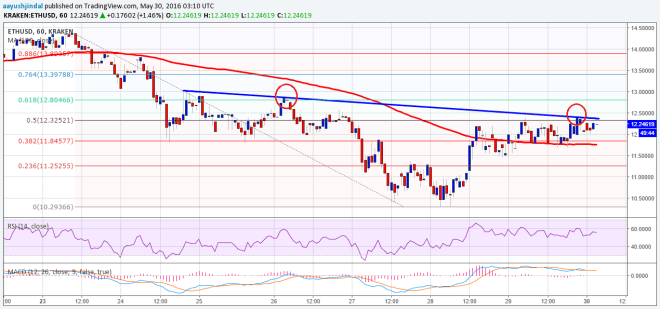

If they fail, then a move down towards the 100 SMA is likely. I think there should be an attempt to break the trend line and resistance, which can be seen as a buying opportunity with a stop below the 100 hourly SMA.
Hourly MACD – The MACD is about to change the slope to the bullish zone, which is a positive sign.
Hourly RSI – The RSI is above the 50 level, calling for more gains.
Intraday Support Level – $11.76
Intraday Resistance Level – $12.50
Charts courtesy of Kraken via Trading View
Header Image NewsBTC