Key Highlights
- ETH price moved down a few points versus the US Dollar, but found bids near a major support.
- This week’s highlighted bullish trend line on the hourly chart (data feed via SimpleFX) of ETH/USD continued to act as a barrier for the sellers.
- The price is currently bouncing from the trend line support and looks set for more gains.
Ethereum price after a minor correction against the US Dollar found support near a trend line and currently trading back higher.
Ethereum Price Upside Move
Ethereum price remained lower yesterday against the US Dollar until it found support near a major technical level. I am tracking a major bullish trend line on the hourly chart (data feed via SimpleFX) of ETH/USD this week. It acted as a support on many occasions and provided bids. Yesterday, the price once again tested the same trend line. However, the ETH bulls successfully managed to defend the downside move.
Moreover, the 38.2% Fib retracement level of the last wave from the $11.15 low to $12.12 high also played a major role. It all formed a major support and acted as a barrier for sellers. This was not all, as the 100 hourly simple moving average was also around the same trend line support. The price is again moving back higher and may gain further.
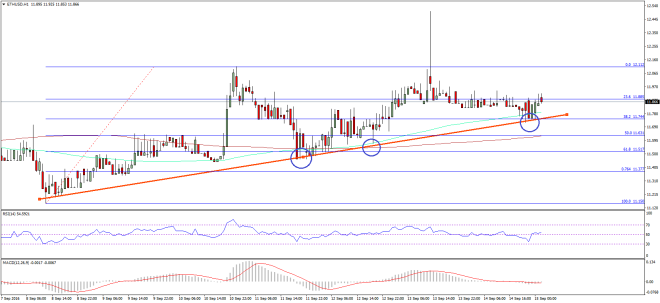

On the upside, the $11.90-12.00 area is acting as a resistance and protecting gains. A break above is needed for a push back towards the last swing high of $12.12. In my view, as long as the trend line holds, ETH/USD could break $12.00. Buying may be considered but with caution and a tight stop.
Hourly MACD – The MACD is currently moving back in the bullish zone, which is a positive sign.
Hourly RSI – The RSI is now back above the 50 level, calling for upsides.
Major Support Level – $11.74
Major Resistance Level – $12.00
Charts courtesy – SimpleFX