Key Highlights
- ETH price after failing to retain the bullish bias against the US Dollar failed and moved down.
- Yesterday’s highlighted bullish trend line on the hourly chart (data feed via SimpleFX) of ETH/USD was cleared by sellers during the recent downside.
- ETH bulls must trade carefully, as there is a chance of a downside move in the short term.
Ethereum price was trading above a short-term support versus the US Dollar until sellers appeared and took ETH/USD lower.
Ethereum Price Downside Move
Ethereum price looks like made a short-term top near $13.21 against the US Dollar. There was a move below the 38.2% Fib retracement level of the wave from the $12.59 low to $13.21 high, which ignited further downsides in ETH/USD. The most crucial point for the bulls is the fact that the price broke a couple of important support zones.
Yesterday, I highlighted a bullish trend line on the hourly chart (data feed via SimpleFX) of ETH/USD. During the recent downside move, the sellers managed to break It. Not only that, they also succeeded in breaking the 50% Fib retracement level of the wave from the $12.59 low to $13.21 high. At this moment, they are attempting for a close below the 100 hourly simple moving average. If they succeed, it will further increase the bearish pressure on the ETH buyers.
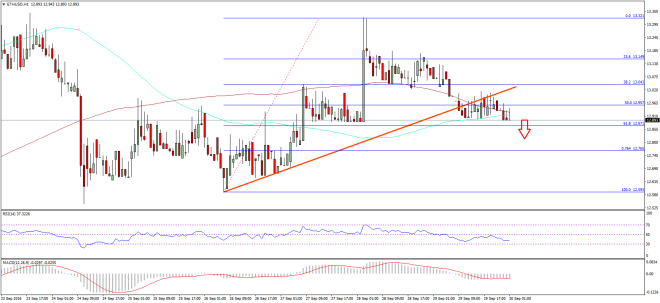

So, if you are a buyer, you need to trade carefully moving ahead. There is a chance of further declines in ETH/USD. In my view, there is even a possibility of a full test of the last swing low of $12.60. The technical indicators for ETH are turning south, which is a bearish call in the short term.
Hourly MACD – The MACD is now moved into the bullish zone.
Hourly RSI – The RSI is also below the 50 level, calling for more losses.
Major Support Level – $12.80
Major Resistance Level – $13.10
Charts courtesy – SimpleFX