Key Highlights
- Ethereum price stayed elevated against the US Dollar, but I think one should trade carefully moving ahead.
- There is a monster resistance area formed near $15.00, which acted as a barrier on many occasions.
- There is likely a Triple top pattern forming on the daily chart (data feed via Kraken) of ETH/USD, which if valid might call for losses.
Ethereum price is trading near a major confluence resistance area of $15.00. Let us see how we can trade ETH/USD in the current situation.
Ethereum Price Triple Top?
Ethereum price ETH for the third time trading near the $15.00 resistance area vs the US Dollar. The stated level acted as a monster barrier on two occasions earlier, and I stated this many times that it holds the key for the next move in ETH. The price is once again trading near the same levels, and preparing for a break. Now, there are a few things, which we need to consider before trading.
First, there is a chance that ETH/USD is creating a triple top pattern on the daily chart (data feed via Kraken). If the ETH bulls fail to take the price higher, and do not succeed in breaking $15.00, then there is a possibility of a downside reaction in the near term. In that situation, the 23.6% Fib retracement level of the last leg from the $7.00 low to $14.85 high may come into play and act as a support.
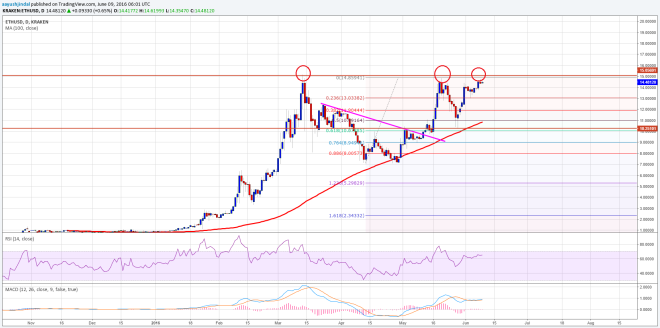

On the other hand, if the buyers succeed in breaking the highlighted resistance zone, then there is a chance of further upsides in ETH/USD. In that case, the 1.236 extension of the last decline may be tested, which is around $18.00.
Daily MACD – The MACD is almost flat, suggesting that the price is preparing for a break.
Daily RSI – The RSI is above the 50 level, which is a positive sign.
Major Support Level – $13.00
Major Resistance Level – $15.00
Charts courtesy of Kraken via Trading View