

Key Highlights
- Ethereum price continued to trade with a bullish bias vs the US Dollar, and may test my final target of $15.00 soon.
- Once again, my yesterday’s idea of buying dips worked, and the price bounced after a minor dip.
- The highlighted bullish trend line formed on the hourly chart (data feed via Kraken) of ETH/USD is still in play and may continue to provide support.
Ethereum price gained further and is about to reach $15.00. We need to wait and see reaction of ETH/USD if it tests the mentioned level.
Ethereum Price Trend Line Support
Ethereum price ETH dipped a few points yesterday, but managed to find bids and started to move higher once again. I highlighted yesterday that as long as ETH/USD is above a bullish trend line formed on the hourly chart (data feed via Kraken), it may continue to move higher. I think the price may test the $15.00 level before it can start a major correction or a downside move. The stated level holds a lot importance, and the ETH bulls must be careful in the short term.
The price is currently trading near the $14.49, and I think it is about to burst and test the $15.00 area. Let’s wait and see how it trades in the near term. On the downside, and initial support is around the 23.6% Fib retracement level of the last wave from the $11.70 low to $14.49 high, which holds the key, as the highlighted bullish trend line is also positioned near it.
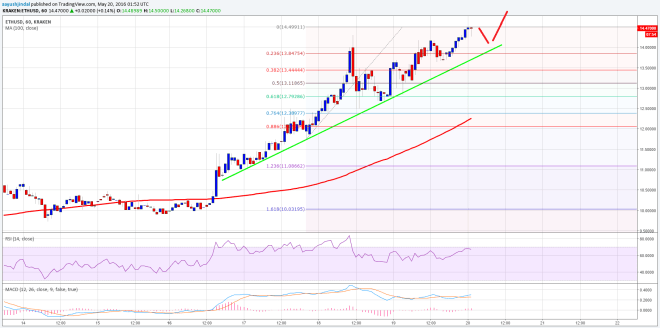

A break of the highlighted bullish trend line support may call for a short term trend change.
Hourly MACD – The MACD is in the bullish zone, pointing towards more upsides.
Hourly RSI – The RSI is above the 50 level, signaling the fact that ETH buyers are in control at the moment.
Intraday Support Level – $13.80
Intraday Resistance Level – $14.50
Charts courtesy of Kraken via Trading View
Header Image via NewsBTC