
Key Highlights
- ETH price started a correction yesterday against the US Dollar, but failed to hold the momentum.
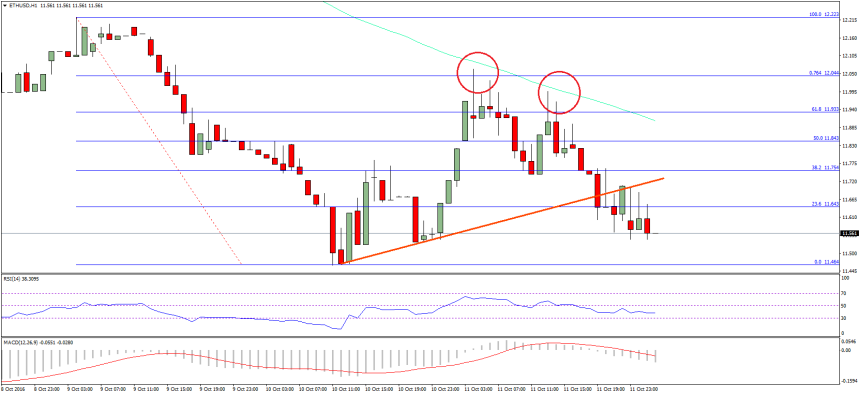
- There was a bullish trend line formed on the hourly chart (data feed via SimpleFX) of ETH/USD, which was broken during the downside reversal.
- The pair found offers near the 100 hourly simple moving average, and declined.
Ethereum price was only able to correct a few points until it found sellers once again versus the US Dollar, and declined towards the last low.
Ethereum Price Hurdle
Ethereum price was seen correcting yesterday against the US Dollar, and I was hoping for it to last a bit longer than it actually did. There was a move above the 50% Fib retracement level of the last drop from the $12.22 high to $11.46 low. However, the upside move could not last longer, as it found sellers and started a downside leg once again.
The price was stopped near a major technical confluence area. It was made of the 76.4% Fib retracement level of the last drop from the $12.22 high to $11.46 low, and the 100 hourly simple moving average. The ETH sellers successfully defended the upside move, and were able to push the price down. During the downside push, there was a break below a bullish trend line formed on the hourly chart (data feed via SimpleFX) of ETH/USD.
The price is now back towards the last swing low of $11.45, and currently finding support near $11.50. It looks like there can be a new low in ETH/USD before the price starts to recover. Let us see what can be the next stop in the short term, which according to me might be at $11.20.
Hourly MACD – The MACD is back into the bearish zone, with gain in the momentum.
Hourly RSI – The RSI is now back below the 50 level.
Major Support Level – $11.45
Major Resistance Level – $11.80
Charts courtesy – SimpleFX