Key Highlights
- ETH price declined further versus the US Dollar, and traded as low as $11.46.
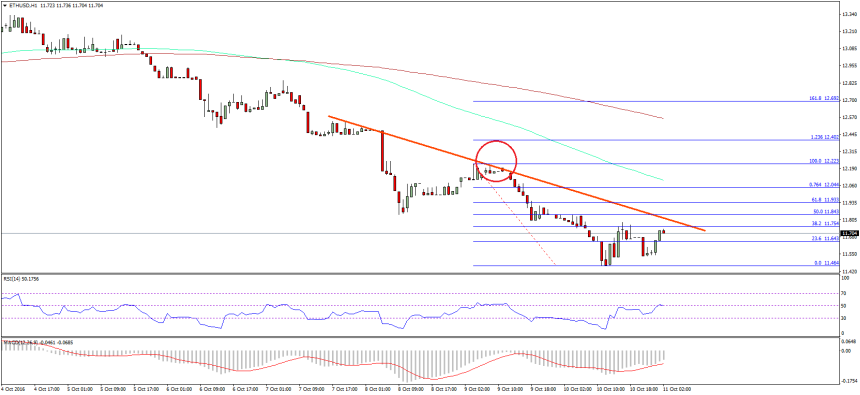
- There is a new short-term bearish trend line formed on the hourly chart (data feed via SimpleFX) of ETH/USD, which may provide a relief rally.
- The pair is finding support near $11.50, which may produce a bounce in the short term.
Ethereum price extended the downside move against the US Dollar to test $11.50. Let’s see if the price can recover moving ahead or not.
Ethereum Price Resistance
Ethereum price broke down further as sellers remained in action. There was a break below the $11.60 support area for a move towards $11.50. Once again a new weekly low was formed at $11.46. The price was seen correcting higher yesterday, but it found sellers near $12.10. I was correct when I called for a test of the 1.618 extension of the last swing from the $11.84 low to $12.28 high. The price not only tested it, but also broke it for a new low.
The ETH/USD pair is once again attempting a recovery, and already moved above the 23.6% Fib retracement level of the last drop from the $12.22 high to $11.46 low. So, there is a chance of more upsides in the near term. On the upside, there a new short-term bearish trend line formed on the hourly chart (data feed via SimpleFX) of ETH/USD. It may be seen as a resistance along with the 50% Fib retracement level of the last drop from the $12.22 high to $11.46 low.
However, there is a chance of a break above the trend line resistance, which may open the doors for a recovery.
Hourly MACD – The MACD is currently in the bearish zone, but attempting to decrease the pressure.
Hourly RSI – The RSI is attempting to move above the 50 level, which is a positive sign.
Major Support Level – $11.50
Major Resistance Level – $11.90
Charts courtesy – SimpleFX
