
Key Highlights
- ETH price gained bids during the past 24 hours as forecasted against the US Dollar.
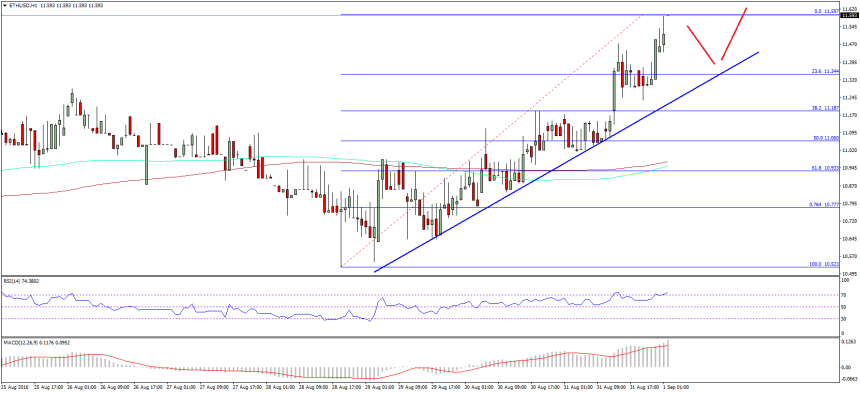
- Yesterday’s highlighted bullish trend line on the hourly chart (data feed via SimpleFX) of ETH/USD acted as a perfect support for the pair.
- The ETH/USD pair traded above the $11.50 level, which is a positive sign in the near term.
Ethereum price surged higher against the US Dollar and broke a couple of important resistances to set a bullish trend in the short term.
Ethereum Price Upside Move
Ethereum price ETH gained heavily during the past 24 hours and remained in a nice uptrend versus the US Dollar. My yesterday’s forecast of more gains in ETH worked perfectly as we witnessed an upside move. There was a move above a couple of important resistance levels, which helped the bulls in gaining momentum. The price broke the $11.50 level, which was a major hurdle on the upside for more gains in the near term.
A key point to note is that the price managed to hold yesterday’s highlighted bullish trend line on the hourly chart (data feed via SimpleFX) of ETH/USD. The recent trend looks positive for the ETH and it looks like the price may continue to move higher. If it corrects lower from the current levels, then an initial support is around the 23.6% Fib retracement level of the last leg from the $10.52 low to $11.59 high.
However, the most important support is around the highlighted trend line. It may continue to act as a buy area. As long as the price is above it, there are chances of more gains in ETH going forward.
Hourly MACD – The MACD is sitting comfortably in the bullish zone, which is a positive sign.
Hourly RSI – The RSI is around the overbought levels, which may ignite a minor correction in ETH.
Major Support Level – $11.20
Major Resistance Level – $11.60
Charts courtesy – SimpleFX