Key Highlights
- Ethereum price after surging higher started a correction yesterday, and currently preparing for a break.
- There is a contracting triangle pattern formed on the hourly chart (data feed via Kraken) of ETH/USD, which may provide us the next move.
- My idea of buying continued to play well, as the ETH bulls bought every major dip in ETH/USD.
Ethereum price is currently trading with a positive bias against the US Dollar, and if the current trend remains intact more gains are likely.
Ethereum Price Resistance
Ethereum price ETH started a correction phase yesterday after a strong rise against the US Dollar. The price traded lower and almost tested the 50% Fib retracement level of the last leg from the $10.84 low to $12.86 high where the bulls appeared. There was buying interest noted around the stated level, which pushed the price higher once again.
Currently, the price is approaching the last swing high of $12.86, but at the same time forming a contracting triangle pattern formed on the hourly chart (data feed via Kraken) of ETH/USD. The highlighted triangle pattern looks like a bullish triangle, which may pave the way for more upsides in the short term. Almost all technical indicators are positive, and suggesting more gains.
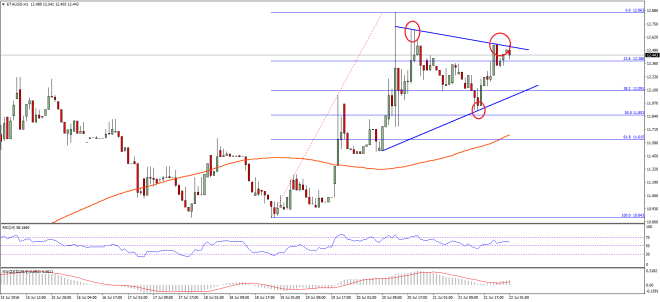

I think we can consider a buy trade on dips as long as the price is above the triangle support area. A stop should be below it, since a break below it could take the price towards the 61.8% Fib retracement level of the last leg from the $10.84 low to $12.86 high. The 100 hourly simple moving average is also positioned around the stated level, waiting to provide support to the ETH/USD pair if it moves down.
Hourly MACD – The MACD is in the bullish zone, suggesting a bullish bias.
Hourly RSI – The RSI is also above the 50 level, which is a positive sign.
Major Support Level – $12.10
Major Resistance Level – $12.60
Charts courtesy – SimpleFX