Key Highlights
- ETH price after setting a high against the US Dollar moved down and traded below the $13.60 level.
- Yesterday’s highlighted bullish trend line on the hourly chart (data feed via SimpleFX) of ETH/USD was broken to open the doors for more losses.
- My suggestion to stay alert yesterday was correct, as the price corrected lower sharply.
Ethereum price after making a new high versus the US Dollar created a top and started moving lower. More losses to follow?
Ethereum Price Correction
Ethereum price recently posted a high of $14.25 against the US Dollar where sellers appeared and protected any further gains. I cautioned yesterday stating that the price is in the overbought territory and may move down soon. The price did correct lower and broke not only the $14.00 handle, but also closed below the $13.60 support area.
During the downside move, there was a break below yesterday’s highlighted bullish trend line on the hourly chart (data feed via SimpleFX) of ETH/USD. Moreover, the price cleared the 23.6% Fib retracement level of the last wave from the $12.01 low to $14.25 high. However, the downside found support near the 100 hourly simple moving average. Furthermore, the 50% Fib retracement level of the same wave acted as a barrier for the sellers.
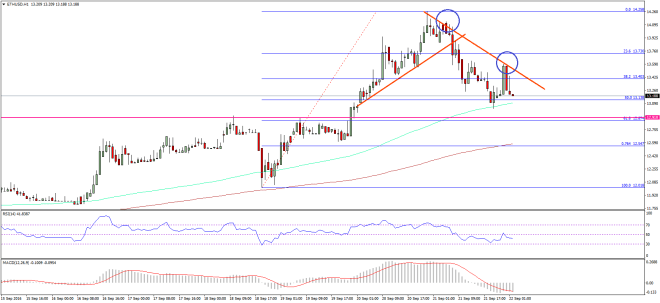

Now, the price is attempting to move higher once again. However, there is a bearish trend line on the hourly chart, which is acting as a resistance. I think as long as the price is below the trend line resistance, there is a chance of more declines in the near term. ETH/USD might have created a short-term top for a move back towards the $13.00 handle at least.
Hourly MACD – The MACD is now in the bearish zone, and suggesting a toppish pattern.
Hourly RSI – The RSI is back below the 50 level after remaining in the overbought readings.
Major Support Level – $13.00
Major Resistance Level – $13.80
Charts courtesy – SimpleFX