Key Highlights
- Ethereum price started recovering against the US Dollar, and managed to improve by a fair margin.
- Yesterday’s highlighted bearish trend line on the hourly chart (data feed via Kraken) of ETH/USD was broken, which opened the doors for more gains.
- The price is now well above the 100 hourly simple moving average, which can be considered as a buy zone.
Ethereum price climbed higher, and finally started recovering. Can it continue trading higher or will it move down?
Ethereum Price Recovery
Ethereum price ETH climbed higher against the US Dollar, and gained by more than $3. There was a nice upside move in ETH/USD, taking it above the 100 hourly simple moving average. The price even managed to break yesterday’s highlighted bearish trend line on the hourly chart (data feed via Kraken) of ETH/USD.
All in all, there were a lot of bullish signs, but is it the right time to jump in? Well, I think the price is not yet stable. This can be only a recovery, and it will be very hard to say that the price may move further higher. Currently, the price trading near the 38.2% Fib retracement level of the last drop from the $21.10 high to $10.13, which is acting as a resistance area.
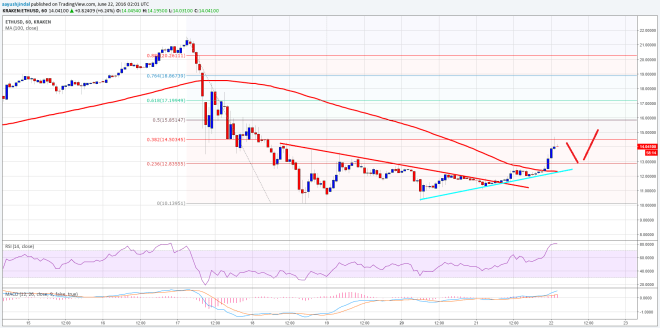

There was a good reaction from the ETH bears around the stated fib level. So, there is a chance of a minor dip from the current levels. On the downside, the 100 hourly simple moving average can be seen as a support area, and may act as a barrier for sellers.
Hourly MACD – The MACD is now in the bullish area, calling for more gains in ETH in the short term.
Hourly RSI – The RSI around the overbought levels, suggesting a minor correction is possible.
Major Support Level – $10.15
Major Resistance Level – $12.40
Charts courtesy of Kraken via Trading View