Key Highlights
- ETH price moved down during the past few sessions against the US Dollar, and struggled to gain traction.
- There is a connecting bearish trend line formed on the hourly chart (data feed via SimpleFX) of ETH/USD, which is acting as a resistance.
- The pair is currently struggling to gain bids for a move higher, which is a concern for the bulls.
Ethereum price slowly moved down from the $11.20 high and currently under a minor bearish pressure versus the US Dollar.
Ethereum Price Resistance
Ethereum price ETH traded positively against the US dollar until it found sellers near $11.20. There was a downside move in ETH/USD, which pushed the pair below the 100 hourly simple moving average. There was a new low of $10.52 formed, as the price slowly moved down. Currently, there is a bearish trend line formed on the hourly chart (data feed via SimpleFX) of ETH/USD, which is acting as a hurdle.
On the upside, the price may continue to face resistance along with the 50% Fib retracement level of the last drop from the $11.09 high to $10.52 low. The ETH buyers need to break the highlighted trend line resistance to be back in action. If we look at the indicators, then there are a few converging signs. If buyers succeed in pushing the price above the trend line, then there is a chance of a test of the 76.4% Fib retracement level of the last drop from the $11.09 high to $10.52 low.
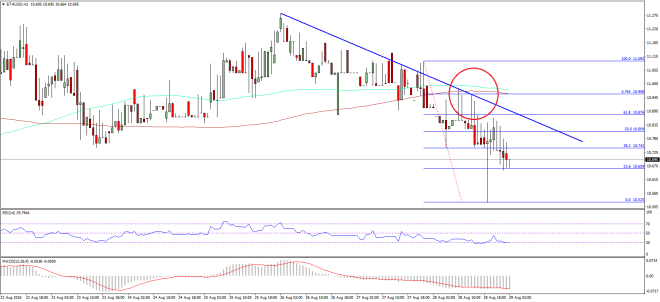

On the downside, we need to keep an eye on the $10.50 level, which is a major support area. In my view, selling should be avoided in ETH, as it may climb higher anytime.
Hourly MACD – The MACD is currently in the bearish zone with no signs of a recovery.
Hourly RSI – The RSI is just around the 30 level, and struggling to move higher.
Major Support Level – $10.50
Major Resistance Level – $11.00
Charts courtesy – SimpleFX