Key Highlights
- ETH price after a couple of spikes lower against the US Dollar managed to recover.
- There is a new bearish trend line formed along with a support on the hourly chart (data feed via SimpleFX) of ETH/USD.
- A break either lower or higher is needed for the next move in ETH/USD.
Ethereum price managed to bounce a couple of times from the lows and currently attempting to break a major resistance area.
Ethereum Price Bearish Trend Line
Ethereum price ETH struggled during yesterday versus the US Dollar and traded lower on a few occasions. However, the ETH buyers appeared later and prevented a downside move. The price finally bounced and moved back above the $10.60 level. Currently, the buyers are attempting to break a bearish trend line on the hourly chart (data feed via SimpleFX) of ETH/USD.
The trend line is also positioned with the 100 hourly simple moving average. Moreover, the 50% Fib retracement level of the last drop from the $11.28 high to $10.52 low is also around the trend line. So, we can safely say that the price is currently trading near a major resistance area. If there is a break above the resistance, then there are chances of more upsides in the near term.
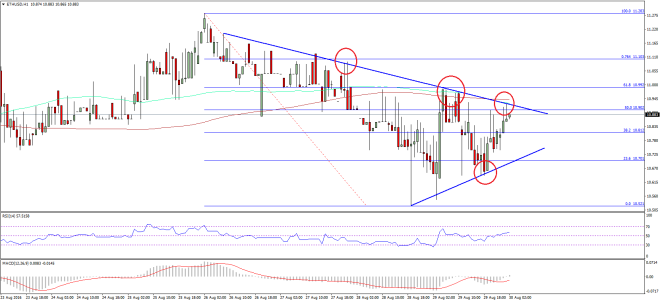

On the downside, there is a minor support trend line formed on the same chart. It may continue to act as a buying zone for the pair. There are a few positive signals on the charts, which may help the pair to break higher and trade above the $11.00 level. My view remains the same, we should avoid selling ETH at this point, and wait for a move higher.
Hourly MACD – The MACD just changed the slope from the bearish to bullish zone.
Hourly RSI – The RSI is also above the 30 level, which is a positive sign.
Major Support Level – $10.50
Major Resistance Level – $11.00
Charts courtesy – SimpleFX