Key Highlights
- Ethereum price started to move down against the US Dollar, and currently testing a support area.
- There is a bullish trend line formed on the hourly chart (data feed via Kraken) of ETH/USD, which is acting as a support area.
- The trend line is also around the 100 hourly simple moving average, which increases the importance of the highlighted support area.
Ethereum price started to correct lower after the recent upside move. ETH to continue moving down or will it recover?
Ethereum Price Support
Ethereum price ETH after trading above the $16.00 level failed to hold gains against the US Dollar and started to move down. The price dropped and broke the 38.2% Fib retracement level of the last leg from the $10.37 low to $16.08 high, which ignited further downsides in ETH.
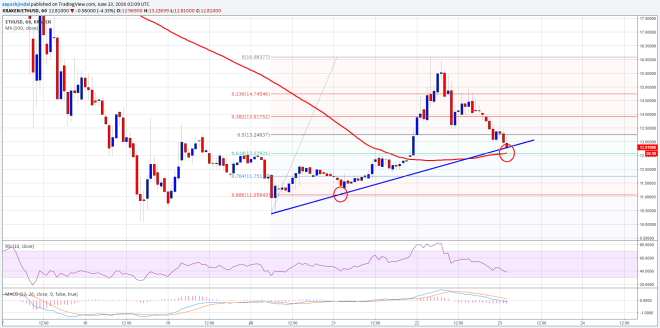

The price is currently trading around a bullish trend line formed on the hourly chart (data feed via Kraken) of ETH/USD, which is protecting a break. Moreover, the 61.8% Fib retracement level of the last leg from the $10.37 low to $16.08 high is also below the trend line, which means there is a chance of it finding bids near the highlighted support area.
Furthermore, the 100 hourly simple moving average is coinciding with the stated fib level, suggesting that there is a lot of crucial levels on the downside. So, if ETH fails to hold the downside, settles below the 100 hourly simple moving average, then it may increase a lot of bearish pressure in the short term.
I would suggest to wait for some time, and see how the price trades near the trend line, and then plan for a trade.
Hourly MACD – The MACD is in the bearish area, calling for more losses in ETH in the short term.
Hourly RSI – The RSI is below the 50 level, which is a bearish sign at the moment.
Major Support Level – $12.50
Major Resistance Level – $14.00
Charts courtesy of Kraken via Trading View