Key Highlights
- Ethereum price continued to trade down against the US Dollar and remained in a downtrend.
- There is a bearish trend line formed on the hourly chart (data feed via Kraken) of ETH/USD, which is acting as a downside mover for the price.
- The price remained under a lot of pressure, which poses a threat of more losses in the short term.
Ethereum price recovered a few points, but found sellers once again. ETH/USD is now below $12.00, which is a bearish sign.
Ethereum Price Downtrend
There was no relief for the ETH buyers, as Ethereum price remained in a downtrend versus the US Dollar. There is a bearish trend line formed on the hourly chart (data feed via Kraken) of ETH/USD, which is acting as a resistance for the upside move and pushing the price down. The worst part is the fact that the pair closed below an important support area of $12.00, which might increase bearish pressure in the short term.
Moreover, the 100 hourly simple moving average is also positioned just above the trend line resistance to act as a barrier for the ETH buyers. An initial resistance on the upside can be around the 23.6% Fib retracement level of the last drop from the $13.02 high to $11.54 low. No doubt, the price is under a lot of pressure, and if the current trend solidifies, ETH/USD may even head towards $11.00 in the short term.
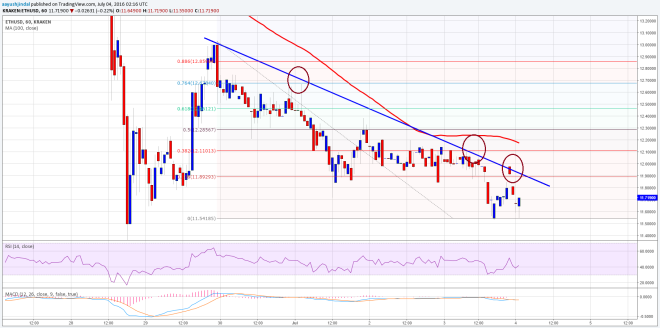

Only a break and close above the trend line resistance can take the price towards the 61.8% Fib retracement level of the last drop from the $13.02 high to $11.54 low, which is at $12.45. I think selling remains the only preferred option at this moment with a stop above the 100 hourly SMA.
Hourly MACD – The MACD is in the bearish slope, calling for more losses.
Hourly RSI – The RSI is also below the 50 level, which is a bearish sign.
Major Support Level – $11.50
Major Resistance Level – $12.00
Charts courtesy of Kraken via Trading View