

Key Highlights
- Ethereum price as forecasted yesterday started a recovery and may continue to trade higher vs the US Dollar.
- There was a nice upside move, as a break above yesterday’s highlighted bearish trend line on the hourly chart (data feed via Kraken) of ETH/USD was noted.
- It looks like the price may climb further in the short term and can test the $13.50 level.
Ethereum price enjoyed a nice recovery vs the US Dollar, and if the current trend in ETH/USD continues, then the price could gain further.
Ethereum Price – Buy Dips
Ethereum price ETH continued to gain strength, and traded higher after posting intraday gains. The upside move was strong enough to break yesterday’s highlighted bearish trend line on the hourly chart (data feed via Kraken) of ETH/USD. The recent break looks positive, and if the ETH bulls remain in control, then there are chances of more gains in the short term.
The price also moved above the 50% Fib retracement level of the last drop from the $14.40 high to $10.29 low, which is a bullish sign. Yesterday, I stated that the price may test the 61.8% Fib retracement level of the wave, and it did test it. Moving ahead, there is a possibility of the price moving a few points down before it can continue to move higher.
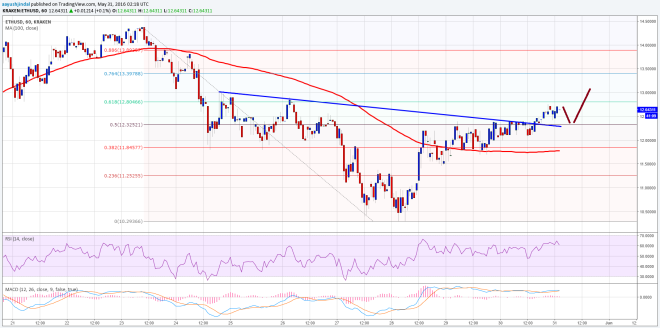

On the downside, the broken trend line may act as a support area, and can be considered as a buy zone. I think as long as the price is above the 100 SMA, it may gain further. So, buyers can place a stop below the 100 hourly SMA.
Hourly MACD – The MACD may change the slope to the bearish zone to ignite a minor downside.
Hourly RSI – The RSI is above the 50 level, which is a positive sign for the bulls.
Intraday Support Level – $12.30
Intraday Resistance Level – $12.80
Charts courtesy of Kraken via Trading View
Header Image via NewsBTC