Key Highlights
- ETH price surged higher towards $13.20 against the US Dollar to form an uptrend.
- There is a bullish trend line formed on the hourly chart (data feed via SimpleFX) of ETH/USD, which may act as a support zone if the pair corrects lower.
- Buying dips remain a good option for ETH, as long as the price remains supported.
Ethereum price traded higher versus the US Dollar and my buy dips idea presented yesterday is playing well in the short term.
Ethereum Price Support
Ethereum price climbed a few points higher during the past 24 hours against the US Dollar to set a high of $13.21. I mentioned yesterday that the price remains supported on the downside, and buying dips may be a good option in the near term. It looks like the presented idea is working well, as the price broke the 61.8% Fib retracement level of the last drop from the $13.34 high to $12.53.
It is a clear signal that the price is now in the third wave and setting up for another upside move. After trading as high as $13.21, it started correcting lower. During the downside, it settled below the 23.6% Fib retracement level of the wave from the $12.59 low to $13.21 high. However, the price remains supported on the downside. As highlighted, there is a bullish trend line formed on the hourly chart (data feed via SimpleFX) of ETH/USD. It may act as a major barrier for the sellers.
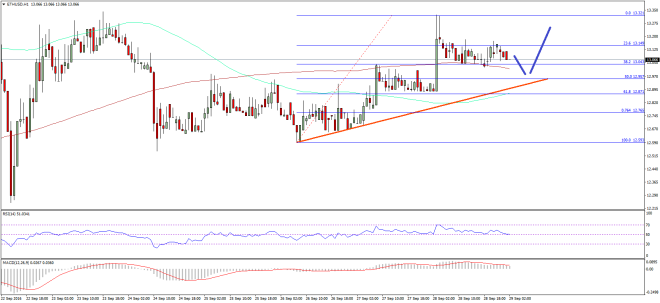

An immediate support is at the 100 hourly simple moving average. There is a chance of a dip towards the trend line to acquire buyers, and then move higher. I think one may consider buying as long as the price is above the trend line support.
Hourly MACD – The MACD is currently in the bullish zone, which is a positive sign.
Hourly RSI – The RSI is also above the 50 level, and signaling an uptrend.
Major Support Level – $12.95
Major Resistance Level – $13.20
Charts courtesy – SimpleFX