

Key Highlights
- ETH price struggled to maintain the bullish bias and traded below the $1170 support against the US Dollar.
- There was a break below a major bullish trend line with support at $1162 on the hourly chart of ETH/USD (data feed via SimpleFX).
- The pair is now trading below the $1140 support level and it looks set for further declines in the near term.
Ethereum price made a short term top against the US Dollar and Bitcoin. ETH/USD is now trading well below $1180 and it may continue to decline further.
Ethereum Price Resistance
After a decent upside move above $1220, ETH price found resistance against the US Dollar. The price formed a short-term top at $1229 and it later started a downside move. There was a break below 23.6% Fib retracement level of the last leg up from the $1079 low to $1230 swing high. The downside move gained pace and the price was able to move below the $1180 support area.
More importantly, there was a break below a major bullish trend line with support at $1162 on the hourly chart of ETH/USD. The pair declined further and traded below the 50% Fib retracement level of the last leg up from the $1079 low to $1230 swing high. This means the price is now back in the bearish zone below $1153. At the moment, the price is trading near a major support at $1120 and the 100 hourly simple moving average. Moreover, the 76.4% Fib retracement level of the last leg up from the $1079 low to $1230 swing high is at $1113.
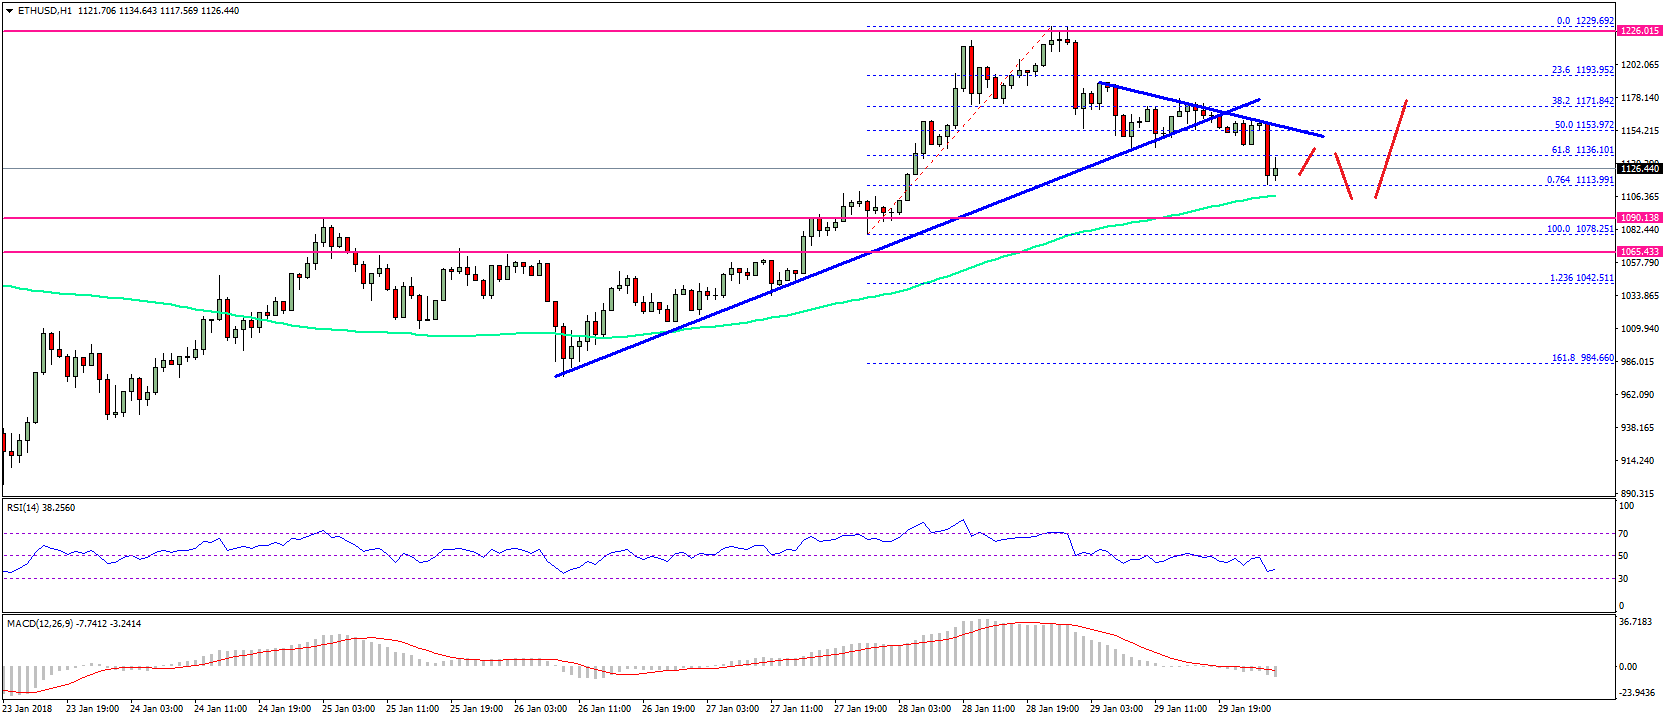

Therefore, the price has to stay above the $1110-1120 support. If it fails to hold $1110, it could decline back towards the $1050 level.
Hourly MACD – The MACD is gaining momentum in the bearish zone.
Hourly RSI – The RSI is now well below the 50 level and is heading lower.
Major Support Level – $1110
Major Resistance Level – $1155
Charts courtesy – SimpleFX