Key Highlights
- ETH price faced a lot of selling pressure and declined below the $760 support against the US Dollar.
- There is a crucial bearish trend line forming with resistance at $821 on the hourly chart of ETH/USD (data feed via SimpleFX).
- The pair recently broke a bullish trend line at $838 and horizontal support at $775 to move into the bearish zone.
Ethereum price is under heavy selling pressure against the US Dollar and Bitcoin. ETH/USD is now in the bearish zone and it could decline further below $715.
Ethereum Price Trend
There was a bearish trend initiated this week from well above $840 in ETH price against the US Dollar. The price started a downside move and traded below the $830 support. There was also a break below a bullish trend line at $838 and horizontal support at $775. It opened the doors for more losses and the price closed below the $775 level and the 100 hourly simple moving average.
A low was formed at $714 recently from where the price started an upside correction. It tested the 23.6% Fib retracement level of the last decline from the $856 high to $714 low. However, it seems like the price is struggling to move above the $750-760 resistance zone. On the upside, there is a major resistance near $775. The stated level was a support earlier and now it may act as a resistance. The stated $775 level is also near the 50% Fib retracement level of the last decline from the $856 high to $714 low.
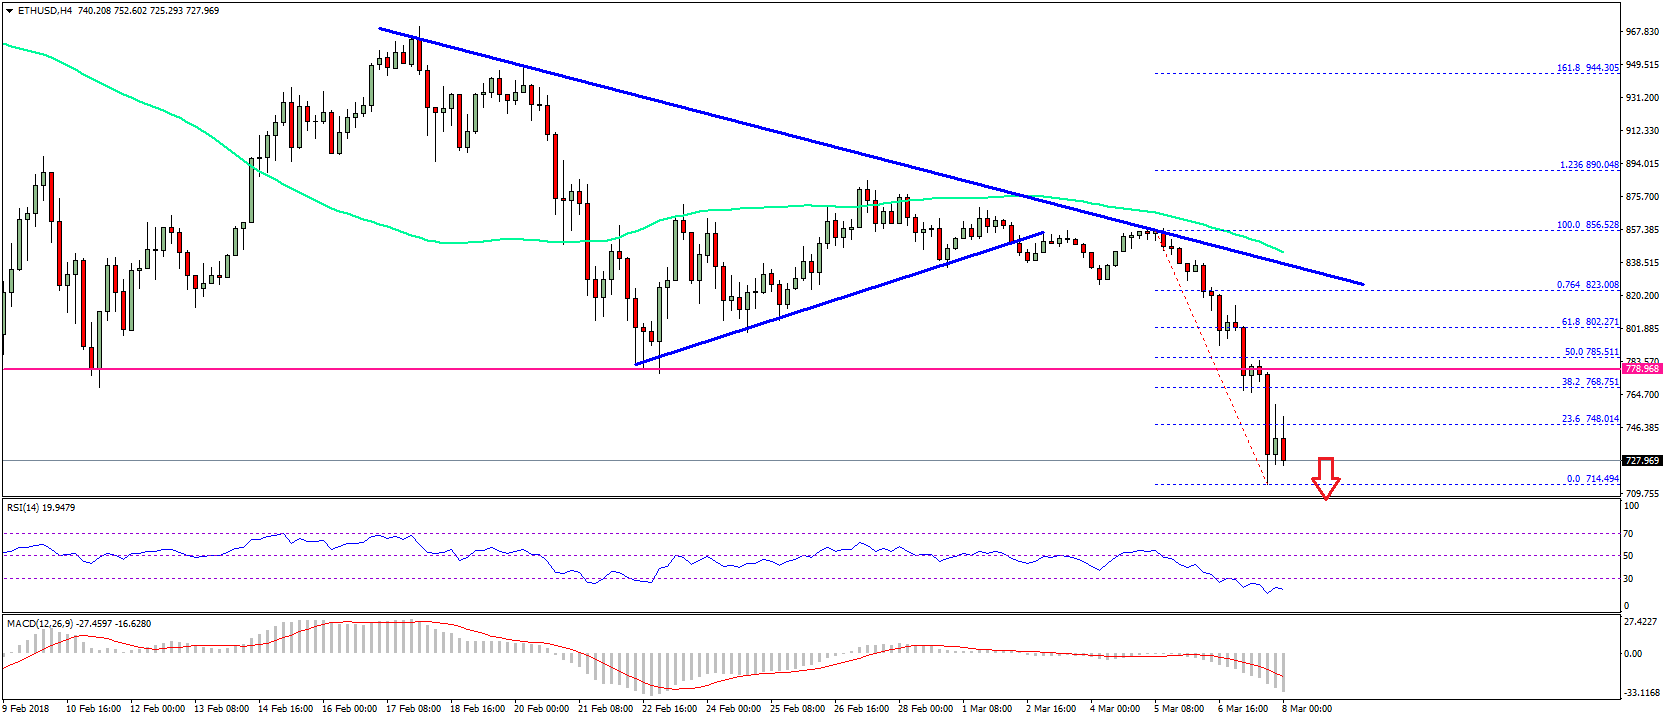

Furthermore, there is a crucial bearish trend line forming with resistance at $821 on the hourly chart of ETH/USD. Overall, the pair is in a bearish trend and it may even break the recent low of $714 low.
Hourly MACD – The MACD is gaining momentum in the bearish zone.
Hourly RSI – The RSI is near extreme oversold levels.
Major Support Level – $700
Major Resistance Level – $775
Charts courtesy – SimpleFX