

Key Highlights
- ETH price found buyers near the $695 level and started recovering against the US Dollar.
- There was a break above a major bearish trend line with resistance at $761 on the hourly chart of ETH/USD (data feed via Kraken).
- The pair is gaining momentum and is currently trading nicely above the $760 level.
Ethereum price is showing positive signs against the US Dollar and Bitcoin. ETH/USD may continue to move higher towards $800 in the near term.
Ethereum Price Trend
Yesterday, we saw a downside correction in ETH price below the $800 level against the US Dollar. The price declined and broke the $760 and $720 support levels. It even broke the 61.8% Fib retracement level of the last wave from the $665 swing low to $833 high. The downside move stopped near the $695 level where buyers appeared.
Later, an upside wave was initiated and the price moved above the $720 level. Buyers pushed the price above the 23.6% Fib retracement level of the last slide from the $829 high to $694 low. More importantly, there was a break above a major bearish trend line with resistance at $761 on the hourly chart of ETH/USD. The pair also succeeded in breaking the $765 resistance and the 100 hourly simple moving average. At the moment, it is trading near the 61.8% Fib retracement level of the last slide from the $829 high to $694 low. A break above the $777 level is needed for more gains in ETH in the near term.
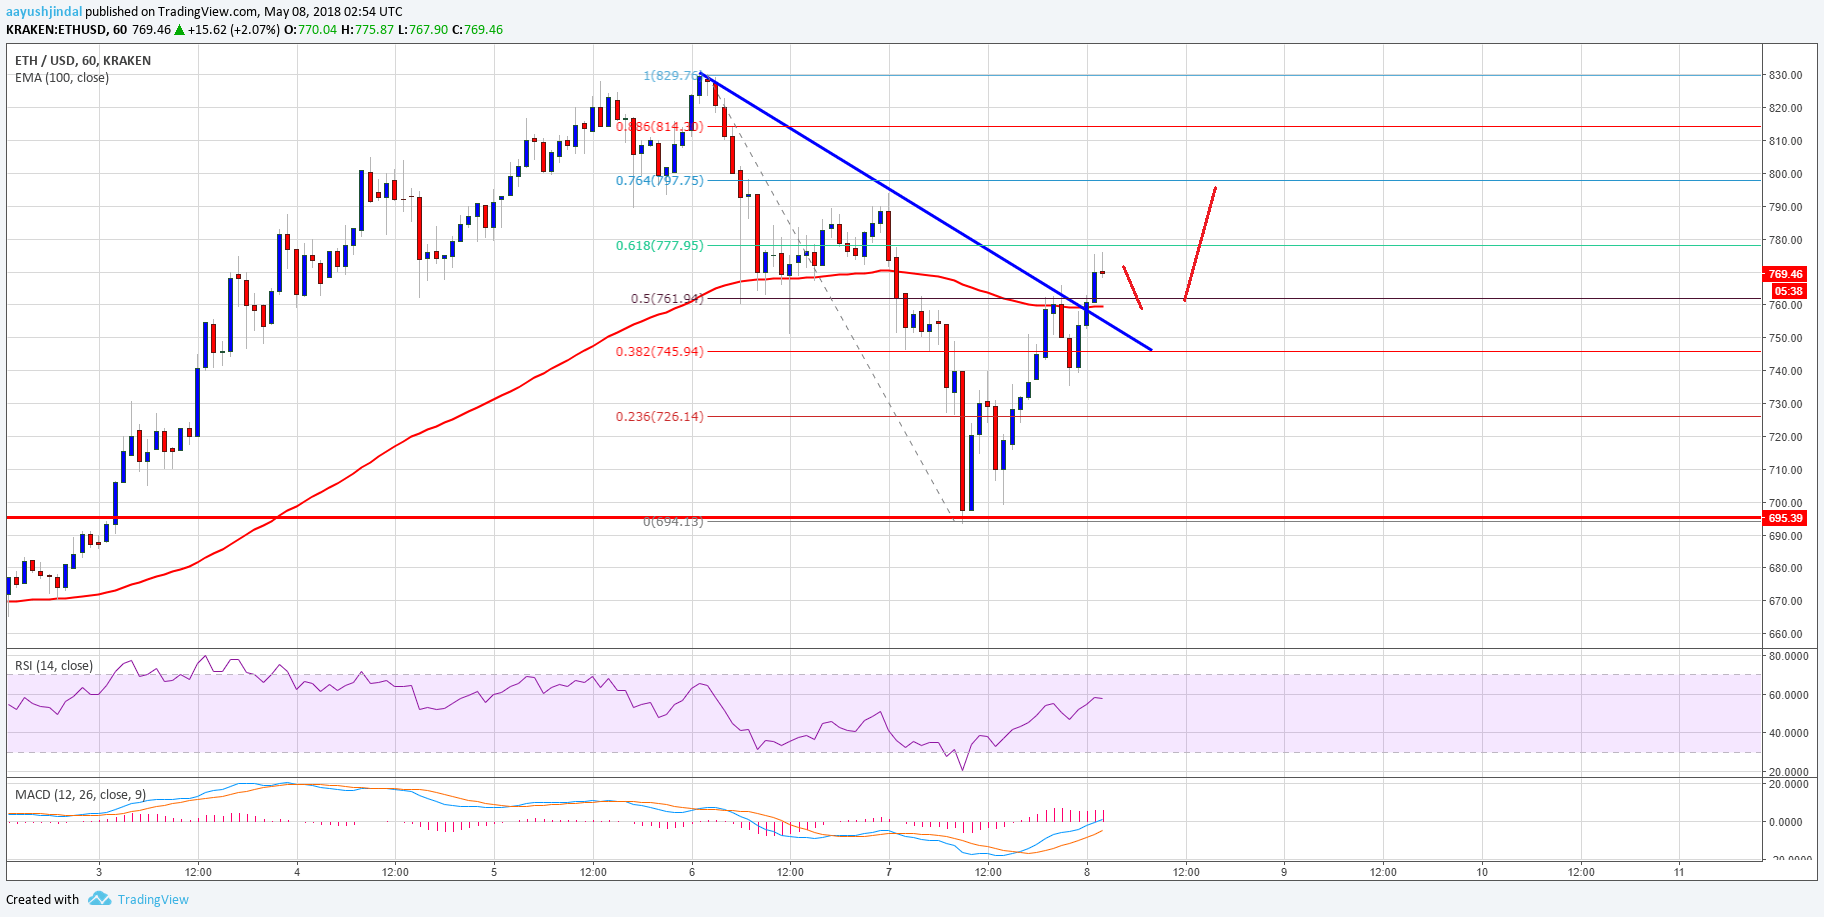

Looking at the chart, the price is showing positive signs above $760. There can be a minor downside correction, but the $760 support and the 100 hourly SMA may prevent declines. Any further losses below $760 could push the price back towards $740. On the upside, a break above $777 would call for a test of $800.
Hourly MACD – The MACD has moved back in the bullish zone.
Hourly RSI – The RSI is now well above the 50 level.
Major Support Level – $760
Major Resistance Level – $777