

Key Highlights
- ETH price started an upside move after declining towards $420-422 against the US Dollar.
- There is a major bullish trend line forming with support at $431 on the hourly chart of ETH/USD (data feed via SimpleFX).
- The pair is currently above the $440 level and the 100 hourly simple moving average, which is a positive sign.
Ethereum price is showing positive signs against the US Dollar and Bitcoin. ETH/USD is gaining pace above $440 and it remains supported on the downside.
Ethereum Price Support
There was a positive movement in ETH price from the $402 low against the US Dollar. The price moved above the $480 level and later started a downside correction. It traded as low as $421.90 and is currently moving higher. Buyers have pushed the price above the 23.6% Fib retracement level of the last decline from the $497.71 high to $421.90 low. The best part was a close above $430 and the 100 hourly simple moving average.
Moreover, the price recently broke a short-term bearish trend line at $440 on the hourly chart of ETH/USD. At the moment, the pair is trading near the 38.2% Fib retracement level of the last decline from the $497.71 high to $421.90 low. A break above the $450 level would open the doors for more gains possibly above the $465 level in the near term. An intermediate resistance sits at $459 and the 50% Fib retracement level of the last decline from the $497.71 high to $421.90 low.
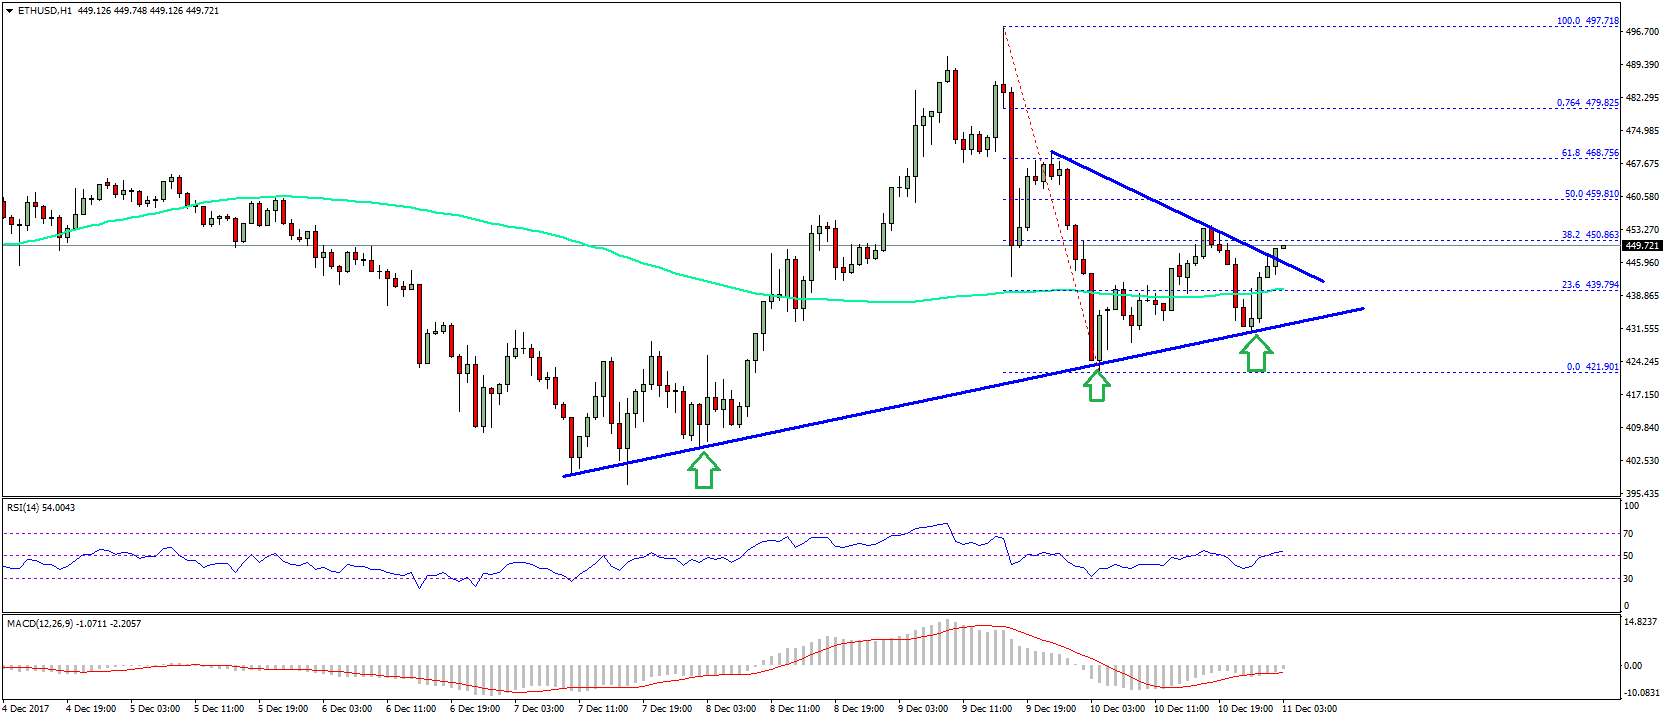
On the downside, the 100 hourly SMA at $439 is an initial support. The next major support is around $431 and a major bullish trend line on the same chart. As long as the ETH/USD is above the $430 level, it might continue to rise in the near term.
Hourly MACD – The MACD is about to move back in the bullish zone.
Hourly RSI – The RSI has just moved above the 50 level and is showing positive signs.
Major Support Level – $430
Major Resistance Level – $460
Charts courtesy – SimpleFX