

Key Highlights
- ETH price declined and corrected lower sharply below the $650 support against the US Dollar.
- There was a break below a major bullish trend line with support at $700 on the hourly chart of ETH/USD (data feed via SimpleFX).
- The pair is currently trading near a major support at $605 and the 100 hourly simple moving average.
Ethereum price is currently correcting lower against the US Dollar and Bitcoin. ETH/USD is now near $605, which is a major support area for buyers.
Ethereum Price Support
There was a downside move initiated from the $759.66 swing high in ETH price against the US Dollar. The price made a sharp decline and moved below the $700 and $650 support levels. During the downside, there was a break below a major bullish trend line with support at $700 on the hourly chart of ETH/USD. It opened the doors for more losses and the pair declined below $650.
The worst part was a break of the 50% Fib retracement level of the last wave from the $510.76 low to $759.66 high. These are bearish signals in the short term. However, the pair is currently trading above a major support at $600-605. The 100 hourly simple moving average is positioned at $606 to act as a major hurdle for more declines. Moreover, the 61.8% Fib retracement level of the last wave from the $510.76 low to $759.66 high is at $605 to act as a support.
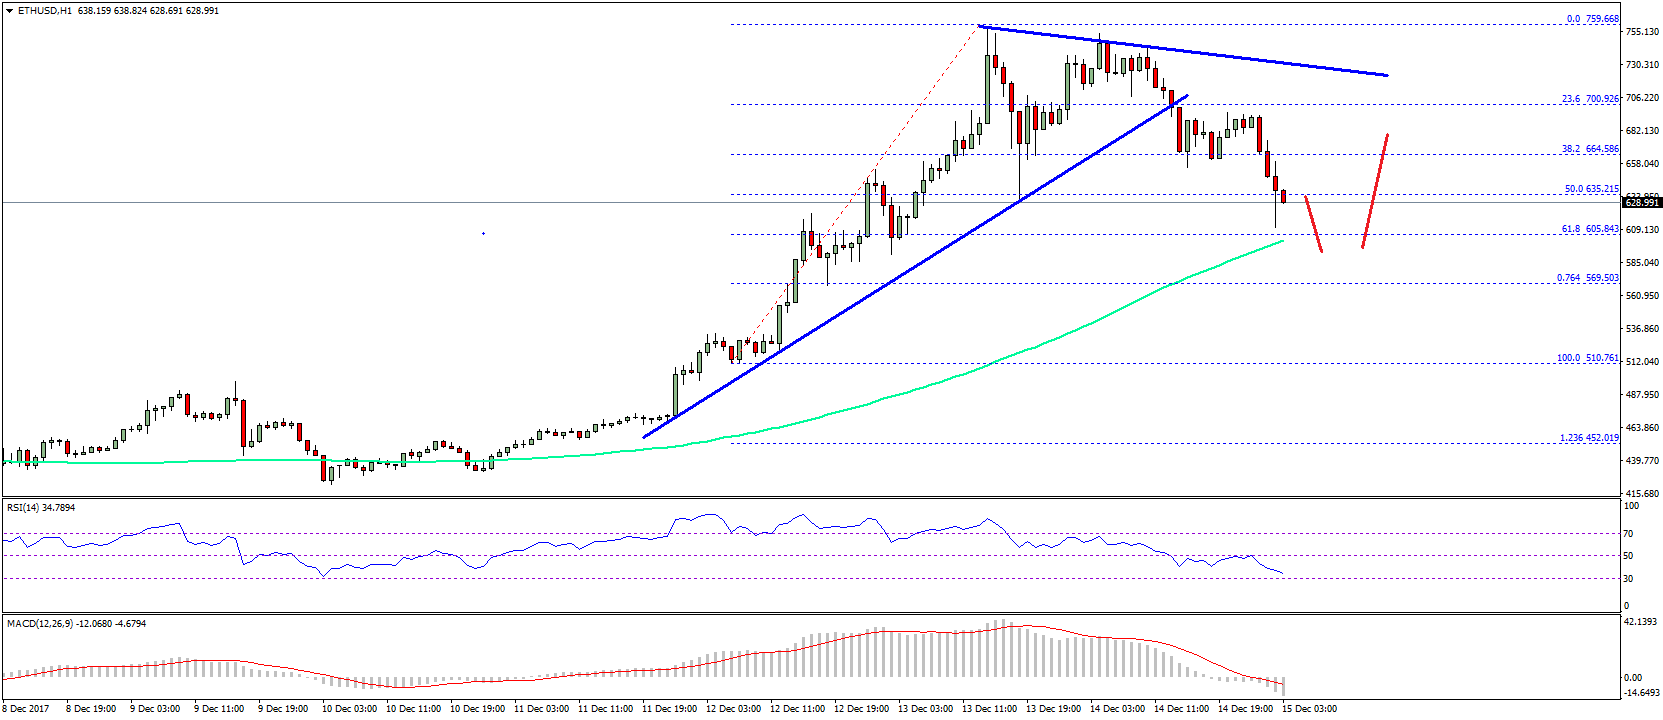
Overall, the $600 and $605 support levels are very important for buyers. The price will most likely find support and move back above $650 in the near term. On the flip side, a break of the $600 support and the 100 hourly SMA could ignite further declines towards the last swing low of $510.
Hourly MACD – The MACD has just moved from the bullish to bearish zone.
Hourly RSI – The RSI is now well below the 50 level.
Major Support Level – $605
Major Resistance Level – $650
Charts courtesy – SimpleFX