Key Highlights
- ETH price is moving lower from the $761 swing high and is now below $740 against the US Dollar.
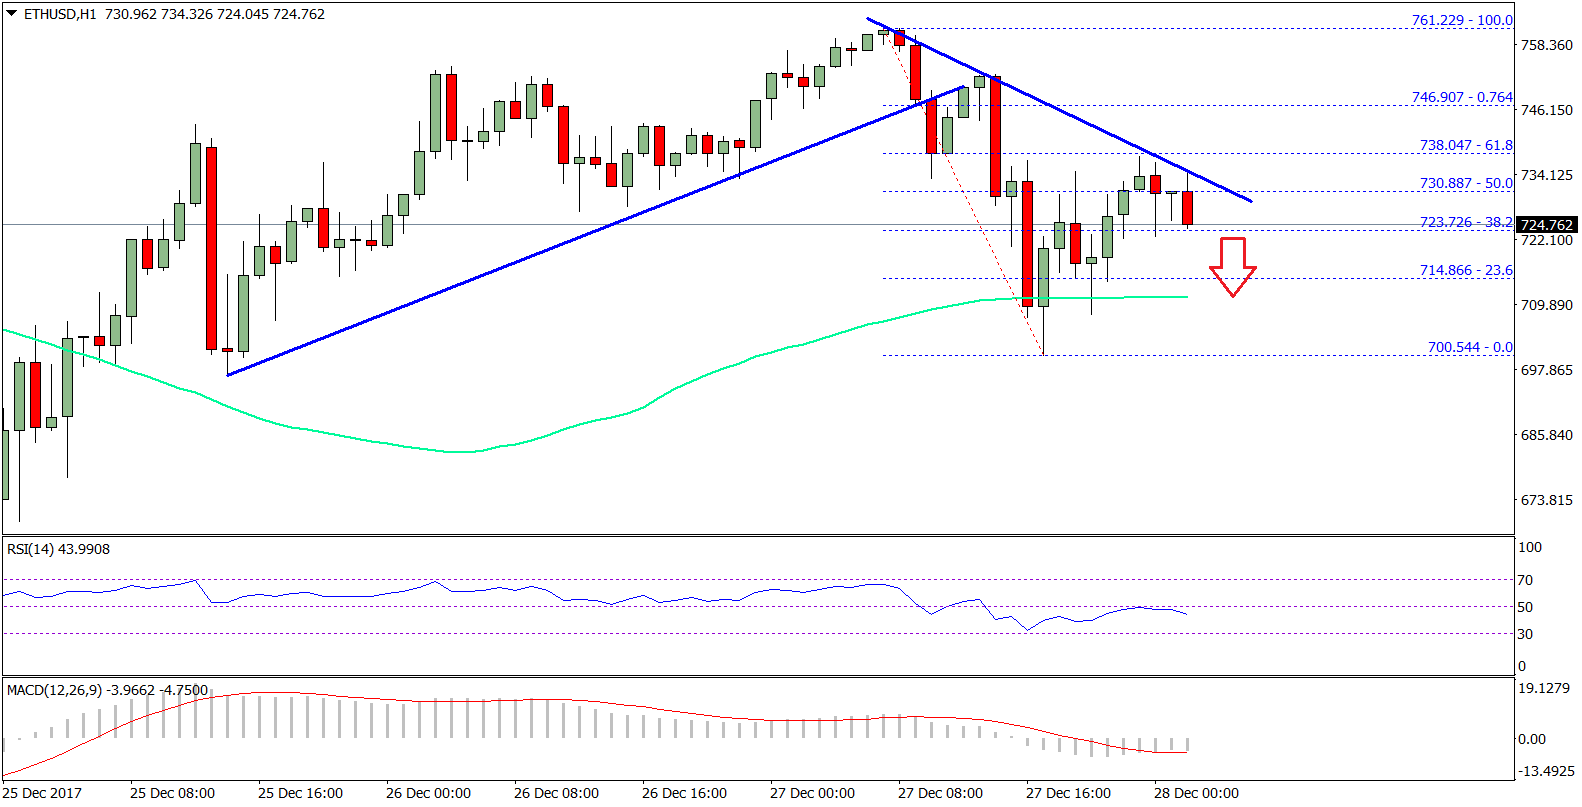
- There was a break below a major bullish trend line at $746 on the hourly chart of ETH/USD (data feed via SimpleFX).
- The pair might continue to decline towards the $715 and $700 support levels in the near term.
Ethereum price is currently correcting lower against the US Dollar and Bitcoin. ETH/USD might decline in the short term to test the $700-715 support area.
Ethereum Price Resistance
There was a slow a steady rise in ETH price above the $750 level against the US Dollar. The price traded higher and traded as high as $761.22, where it faced sellers. A short-term correction was initiated from the mentioned $761 high. ETH moved down and broke the $750 support area. There was also a break below a major bullish trend line at $746 on the hourly chart of ETH/USD.
The pair traded towards the $700 level and formed a low at $700.54. Later, an upside wave was initiated above the $710 level. It moved above the 100 hourly simple moving average and the 23.6% Fib retracement level of the last decline from the $761 high to $700 low. However, the upside move was protected by a bearish trend line on the same chart with current resistance at $730. Moreover, the 61.8% Fib retracement level of the last decline from the $761 high to $700 low also acted as a hurdle.
It seems like the price has completed a short-term correction near $730 and it might decline once again. It can retest the $700 support zone, which is a major buy zone. Overall, the price might continue to trade in a range before making the next move.
Hourly MACD – The MACD is reducing its bearish slope, but there is no bullish sign.
Hourly RSI – The RSI is just below the 50 level and is moving lower.
Major Support Level – $700
Major Resistance Level – $735
Charts courtesy – SimpleFX