Key Highlights
- ETH price formed a bottom near $650 and moved higher above $700 against the US Dollar.
- There is a key breakout pattern forming with resistance at $730 on the hourly chart of ETH/USD (data feed via Kraken).
- The pair must break and settle above $730 and $750 to gain upside momentum in the near term.
Ethereum price started a nice upside move against the US Dollar and Bitcoin. ETH/USD could rise further if it manages an hourly close above $730-750.
Ethereum Price Resistance
After a major downside move, there was a support base formed near $750 in ETH price against the US Dollar. The price started an upside move and traded above the $680 and $700 resistance levels. It even settled above the $700 level, which is a positive sign. A high was formed at $737 from where the price started consolidating in a range pattern.
It already tested the 23.6% Fib retracement level of the last wave from the $651 low to $737 high. It seems like there is a key breakout pattern forming with resistance at $730 on the hourly chart of ETH/USD. The pair may continue to trade inside the triangle with support at $710. If the price fails to hold the $710 support, the next support could be $690. Moreover, the 50% Fib retracement level of the last wave from the $651 low to $737 high is near $694 to act as a support.
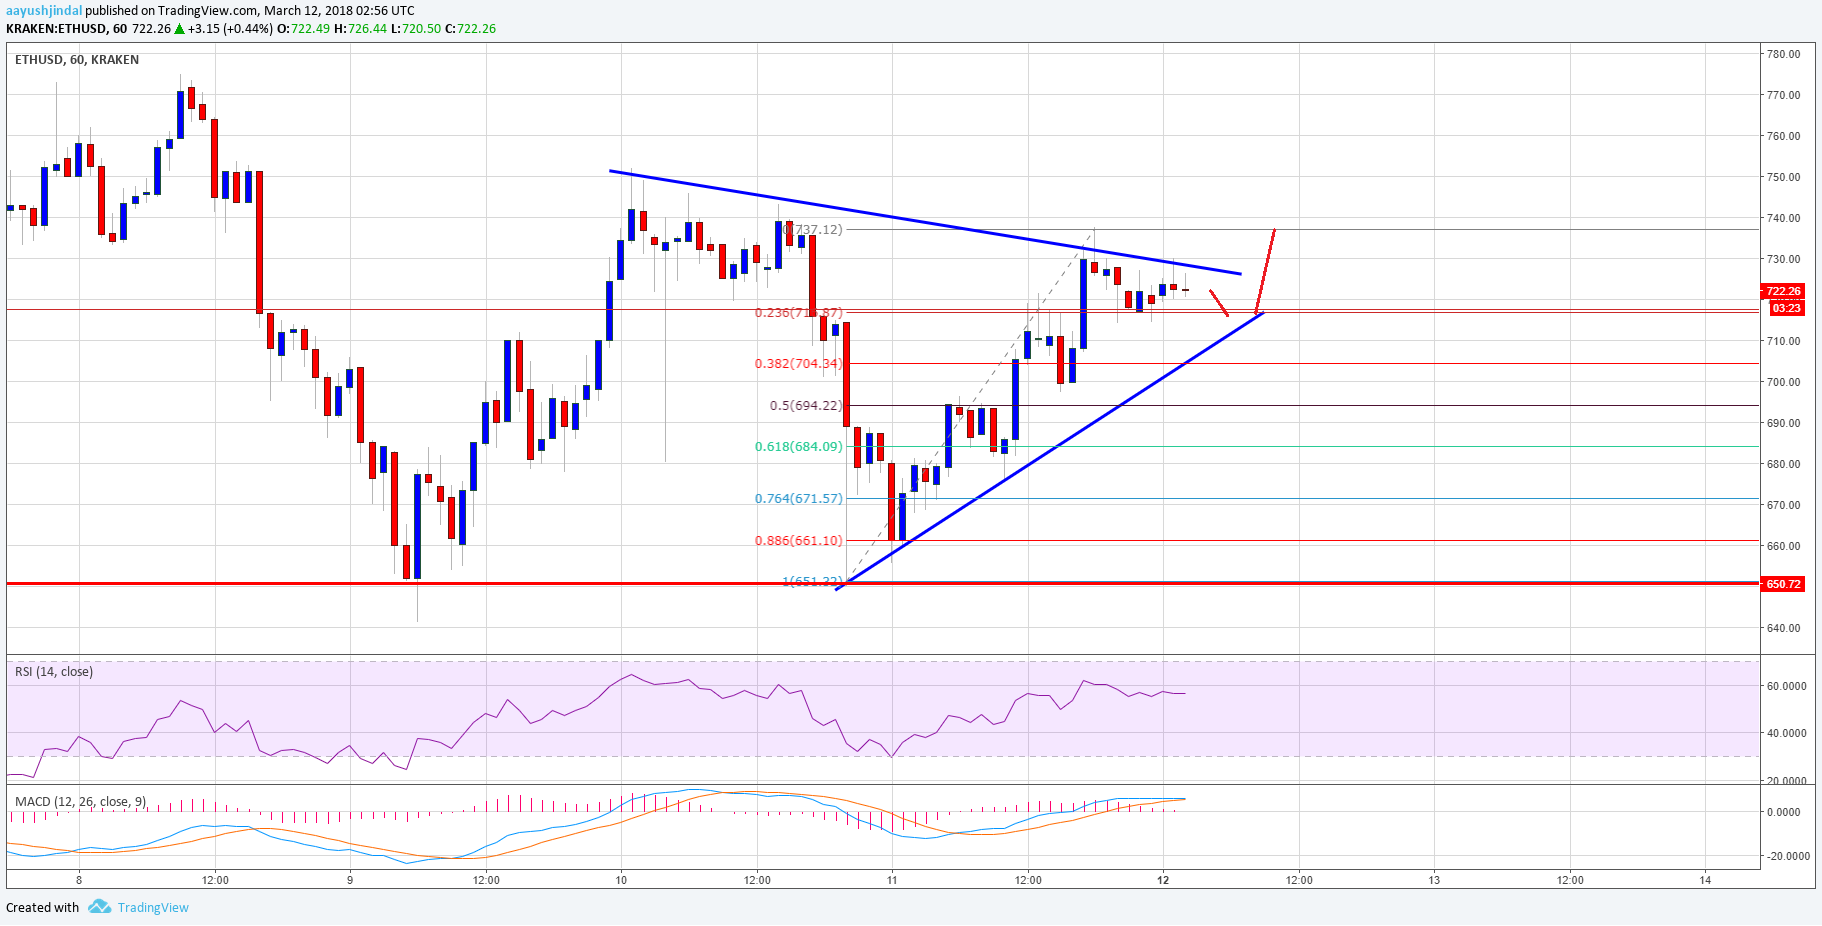

On the other hand, if the pair breaks the $730 resistance, it could even break $750. A proper close above the $730 and $750 levels is needed for more gains. Above $750, the next immediate resistance is near the $770 level, which is also a pivot zone.
Hourly MACD – The MACD is slightly placed in the bullish zone.
Hourly RSI – The RSI is now placed nicely above the 50 level with a few positive signs.
Major Support Level – $710
Major Resistance Level – $750
Charts courtesy – Trading View