

Key Highlights
- ETH price traded higher, but it failed to break the $760 and $770 resistance levels against the US Dollar.
- There is a key connecting bearish trend line forming with resistance at $745 on the hourly chart of ETH/USD (data feed via Kraken).
- The pair is currently under pressure and it may well extend its slide back towards the $715 level.
Ethereum price is struggling to move higher against the US Dollar and Bitcoin. ETH/USD remains at a risk of more losses towards the $715 level in the near term.
Ethereum Price Resistance
Yesterday, there was a start of an upside correction above $720 in ETH price against the US Dollar. The price traded towards the $780 level, but it could not hold gains. It topped around the $776 level and failed to test the $780 level. Moreover, the 61.8% Fib retracement level of the last decline from the $830 high to $694 low also acted as a strong barrier.
Lastly, the price seems to be struggling to settle above $760 and the 100 hourly simple moving average. It is currently under pressure and broke the $740 support level. At the moment, it seems like the price may break the 61.8% Fib retracement level of the last leg from the $693 low to $776 high. If sellers remain in action, the price may even break the $724 support and extend its slide. The next support could $715 or $712. On the upside, there is a key connecting bearish trend line forming with resistance at $745 on the hourly chart of ETH/USD.
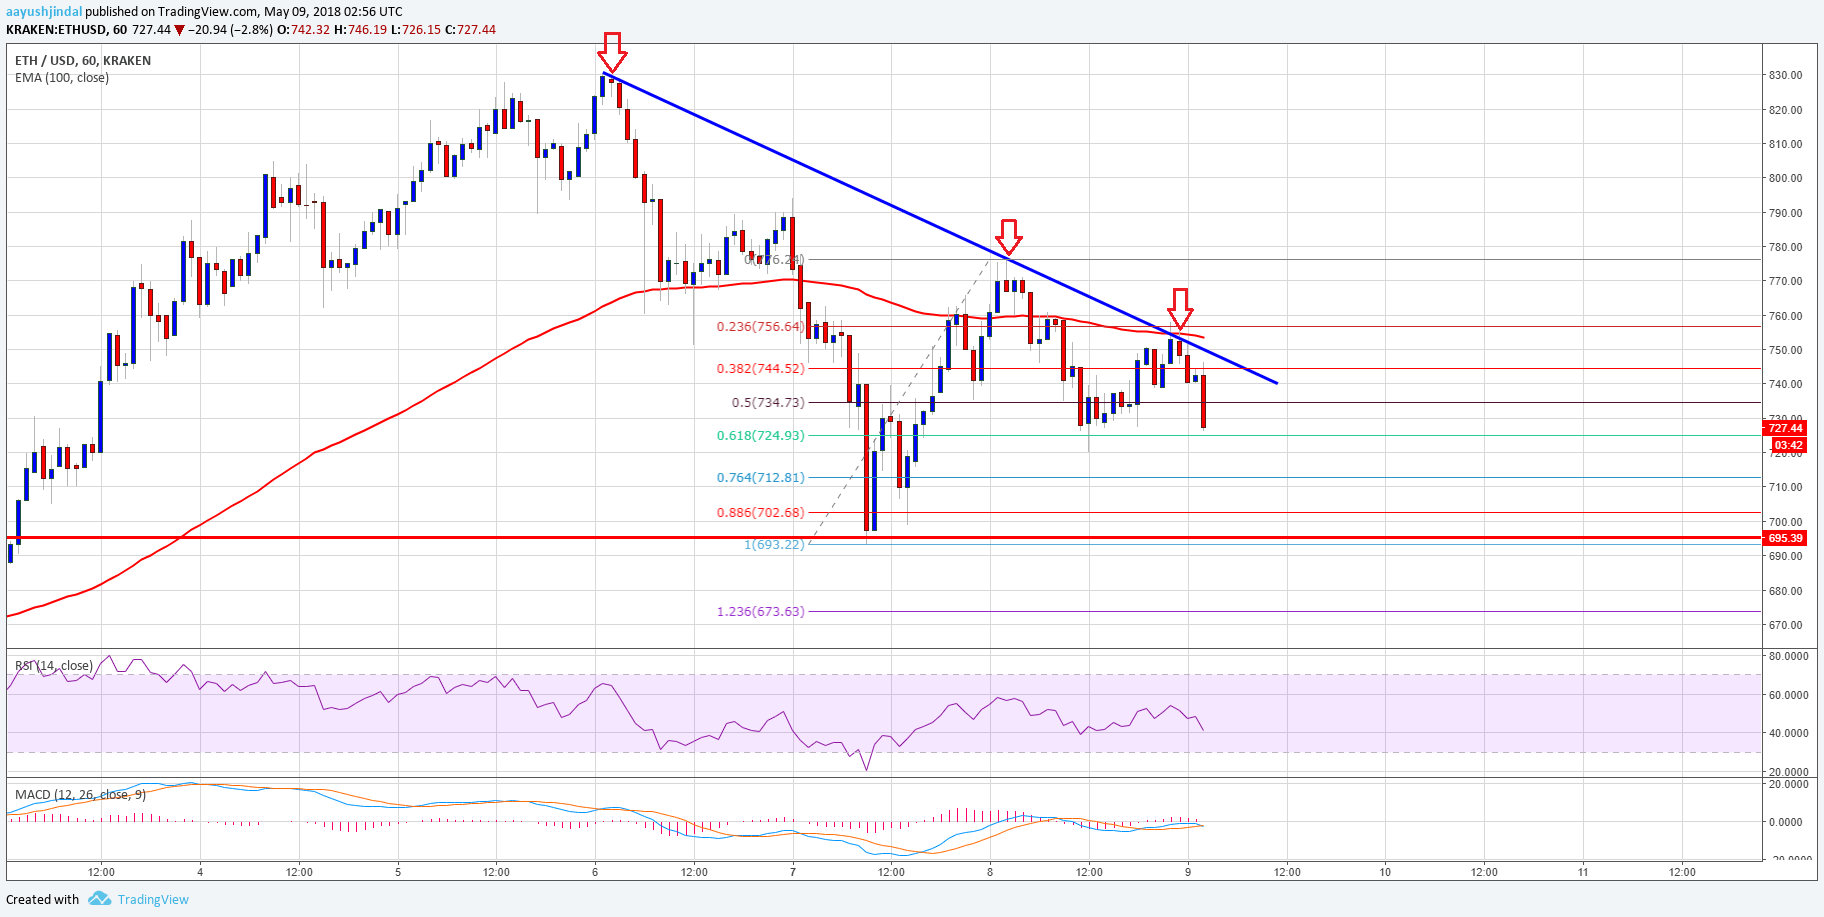

Looking at the chart, the price is clearly under pressure below $745. As long as it is below the trend line, $750, and the 100 hourly SMA, it is likely to extend its decline in the near term.
Hourly MACD – The MACD is gaining pace in the bearish zone.
Hourly RSI – The RSI is about to reach the 40 level.
Major Support Level – $724
Major Resistance Level – $745