Key Highlights
- ETH price is trading in a range above the $680 support level against the US Dollar.
- There is a contracting triangle forming with current support at $684 on the hourly chart of ETH/USD (data feed via Kraken).
- The pair is facing a crucial resistance on the upside near the $730 level and the 100 hourly simple moving average.
Ethereum price is struggling to gain traction against the US Dollar and Bitcoin. ETH/USD must break the $720 resistance and settle above 100 SMA to rise further.
Ethereum Price Range
There were mostly bearish moves below $750 in ETH price against the US Dollar. The price struggled to trade higher and formed a high near $738 yesterday. It failed to hold gains above the $720 level and the 100 hourly simple moving average. As a result, there was a downside reaction below the 50% Fib retracement level of the last wave from the $650 low to $738 high.
However, the downside move was protected by the $680 support. Moreover, the 61.8% Fib retracement level of the last wave from the $650 low to $738 high also acted as a support. At the moment, there is a contracting triangle forming with current support at $684 on the hourly chart of ETH/USD. On the upside, there is a major resistance near $717 and the 100 hourly SMA. Above $717, the triangle resistance trend line is at $735 on the same chart. Therefore, the price has to break the $717 and $735 resistance levels to gain upside momentum.
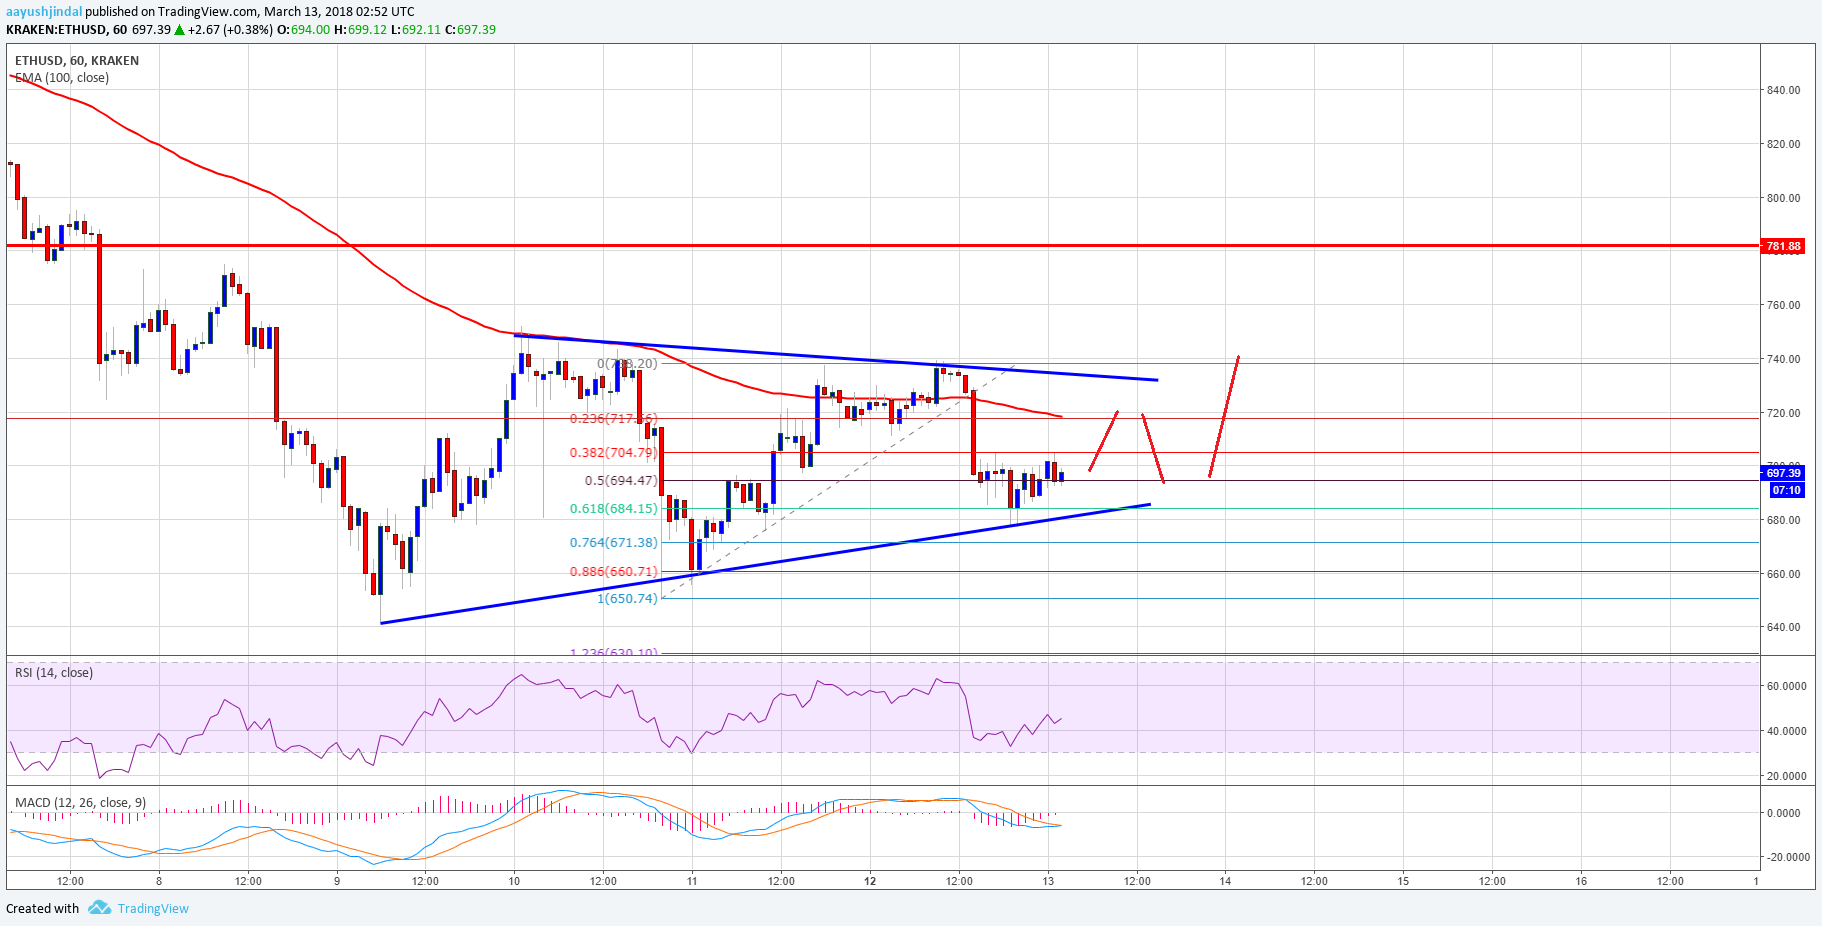

On the downside, the triangle support at $684 holds a lot of importance. A break below the $684 support could ignite a downside move back towards the last swing low of $650 or even $640.
Hourly MACD – The MACD is still in the bearish zone.
Hourly RSI – The RSI is moving higher, but it is still below the 50 level.
Major Support Level – $684
Major Resistance Level – $735
Charts courtesy – Trading View