

Key Highlights
- ETH price failed to move above the $965 and $1,000 resistance levels and declined against the US Dollar.
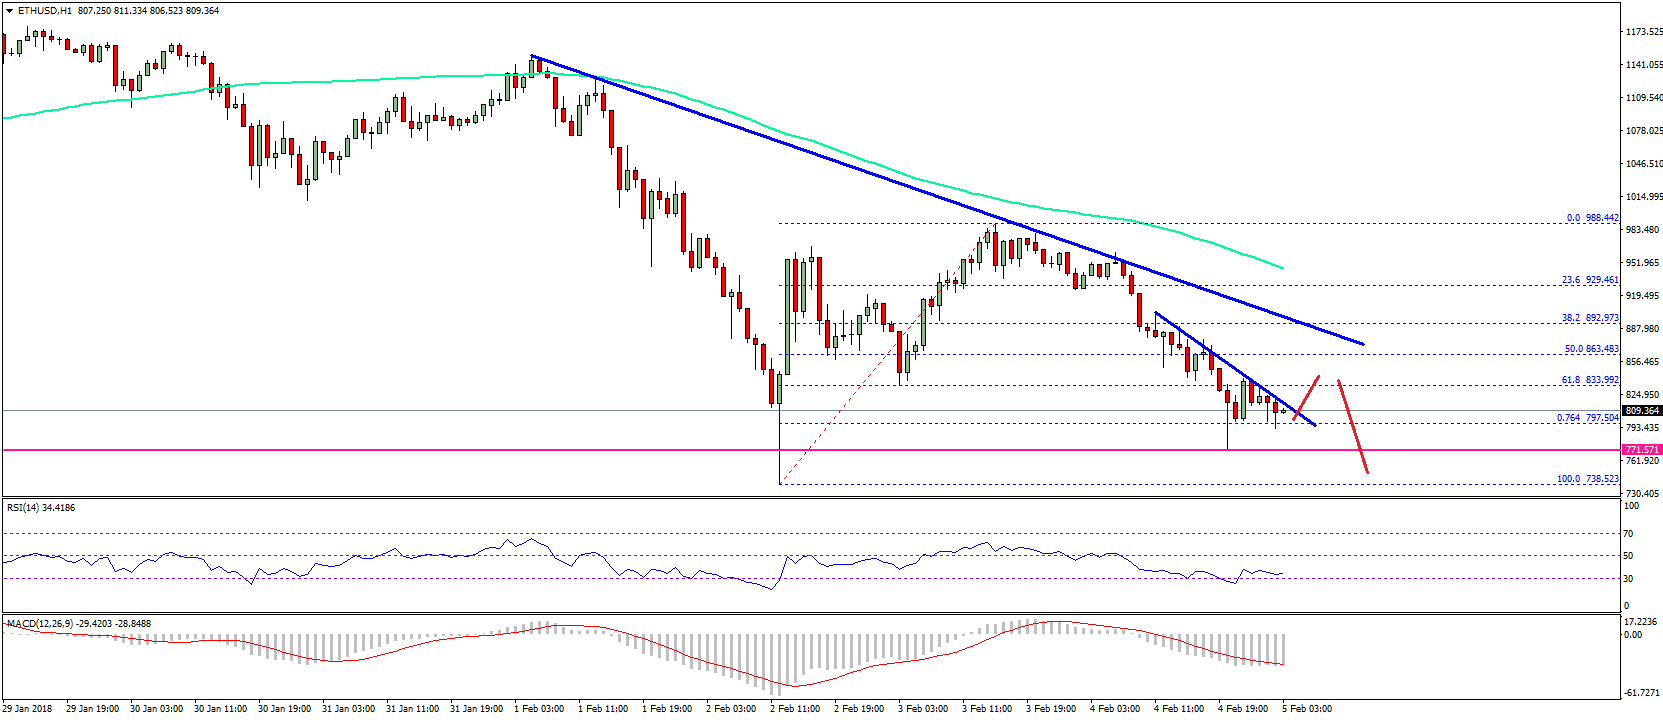
- There are two bearish trend lines forming with resistance at $830 and $865 on the hourly chart of ETH/USD (data feed via SimpleFX).
- The pair is currently trading near the $780-800 support area, which holds a lot of importance in the near term.
Ethereum price declined recently against the US Dollar and Bitcoin. ETH/USD looks like struggling to recover and is currently trading near a major support at $780-800.
Ethereum Price Decline
There was a minor recovery initiated in ETH price above the $850 level against the US Dollar. The price traded above the $900 level and moved towards the $1,000 level. It failed to settle above the $965 and $1,000 resistance levels and started a downside move. The decline was crucial since the price moved below the 50% Fib retracement level of the last wave from the $738 low to $988 high. It seems like the price failed to gain traction and declined back below $900.
The upside move was prevented by a key pivot zone near $960-980. To the topside, there are two bearish trend lines forming with resistance at $830 and $865 on the hourly chart of ETH/USD. The first trend line is not significant and the pair may break it for a move towards $860-880. However, it won’t be easy for buyers to clear the $860-880 resistance area. Above $800, the price may test the 100 hourly simple moving average. At the present, the price is trading just above the 76.4% Fib retracement level of the last wave from the $738 low to $988 high.

If the price fails to stay above $780, there could be a retest of the $735-740 support zone.
Hourly MACD – The MACD is once again gaining momentum in the bearish zone.
Hourly RSI – The RSI is showing a lot of bearish signs.
Major Support Level – $780
Major Resistance Level – $880
Charts courtesy – SimpleFX