

Key Highlights
- ETH price surged above the $640 level recently and traded to a new all-time high at $653 against the US Dollar.
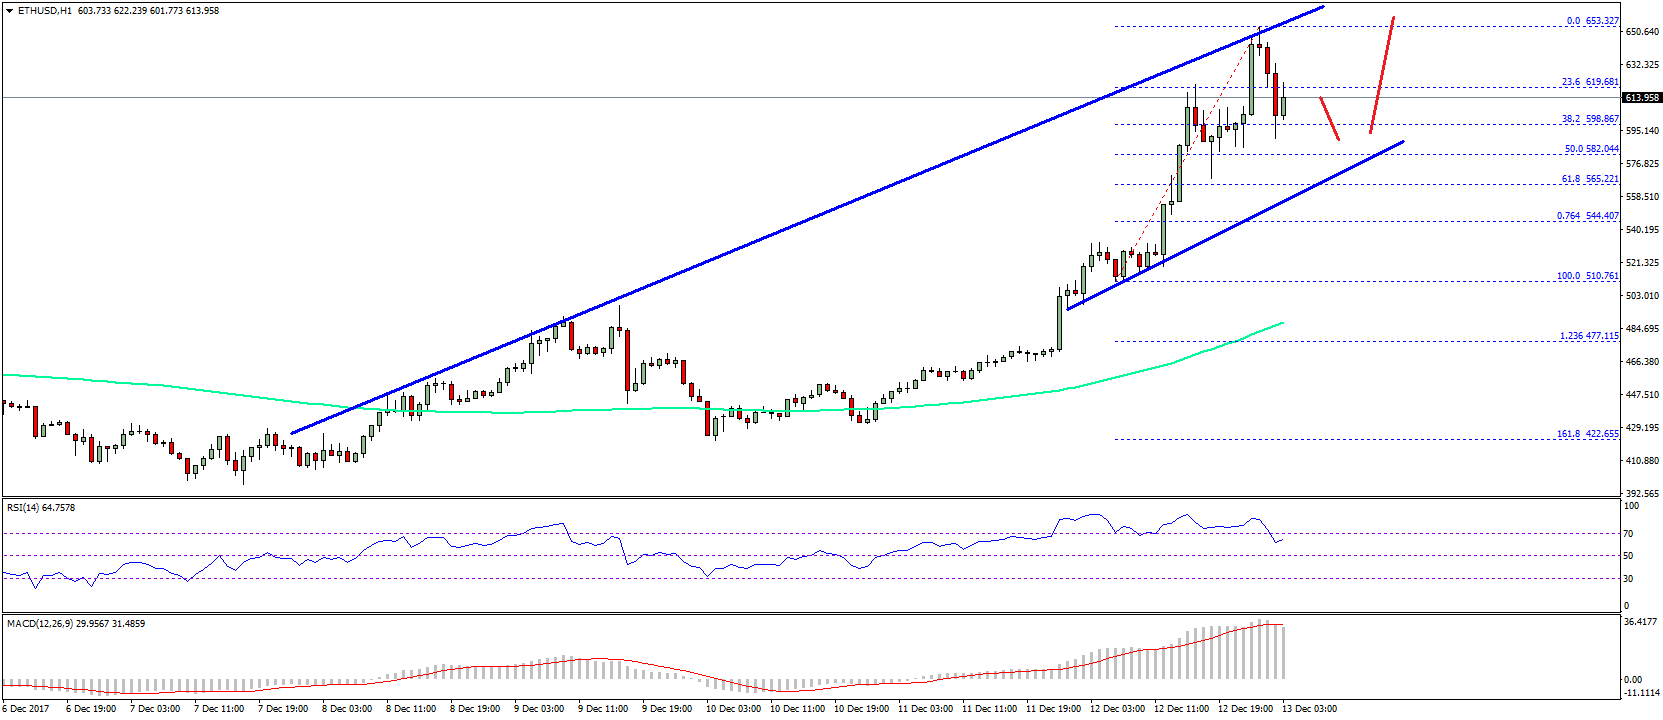
- A monster connecting trend line with resistance near $650-660 is preventing gains on the hourly chart of ETH/USD (data feed via SimpleFX).
- On the downside, there is a bullish trend line with support at $580 on the same chart.
Ethereum price is super bullish against the US Dollar and Bitcoin. ETH/USD is correcting from $653, but it remains well supported for more upsides.
Ethereum Price Uptrend
There were heavy gains in ETH price above the $580 level against the US Dollar. The price surged higher and broke many resistances such as $600 and $640 on the way up. A new all-time high was formed at $653.32 from where the price started a downside correction. It has moved below the 23.6% Fib retracement level of the last wave from the $510.76 low to $653.32 high.
On the upside, there is a monster connecting trend line with resistance near $650-660 on the hourly chart of ETH/USD. The same trend line prevented gains above $653 and it might continue to protect gains. On the downside, the 50% Fib retracement level of the last wave from the $510.76 low to $653.32 high is around $582 to act as a support. Moreover, there is a bullish trend line with support at $580 on the same chart. Therefore, the $580 level is a major support zone for the current wave.
Once the current correction is over, the price might move higher towards $653 once again. A break above the mentioned high could open the doors for more gains towards $680 and $700. On the downside, the $580 and $550 levels are good supports and buy zones.
Hourly MACD – The MACD is showing a lot of bullish signs.
Hourly RSI – The RSI is correcting lower from the overbought levels, but it remains in the bullish zone.
Major Support Level – $580
Major Resistance Level – $653
Charts courtesy – SimpleFX