Key Highlights
- ETH price after a slide towards $16.06 against the US Dollar started a recovery phase.
- Yesterday’s highlighted bearish trend line with resistance at $17.30 on the hourly chart (ETH/USD, data feed via SimpleFX) was broken during recovery.
- The price is currently attempting to break another connecting trend line with resistance at $17.65.
Ethereum price managed to bounce back from the $16.06 low against the US Dollar. Now, can ETH/USD extend the current recovery in the near term?
Ethereum Price Upside Move
There was a solid downside move in ETH price towards $16.05 vs the US Dollar yesterday. The price later managed to stay supported near $16.06 and started a recovery. The upside move was such that the price managed to clear the $16.70 resistance. It first cracked the 38.2% Fib retracement level of the last drop from the $19.10 high to $16.06 low. It opened the doors for an upside move above $17.20.
Later, the price also broke yesterday’s highlighted bearish trend line on the hourly chart (ETH/USD, data feed via SimpleFX) at $17.30. This was a positive sign, and means that the price managed to overcome a lot of selling pressure. At the moment, the price is struggling to break the 50% Fib retracement level of the last drop from the $19.10 high to $16.06 low at $17.57. It needs to clear the same for more gains.
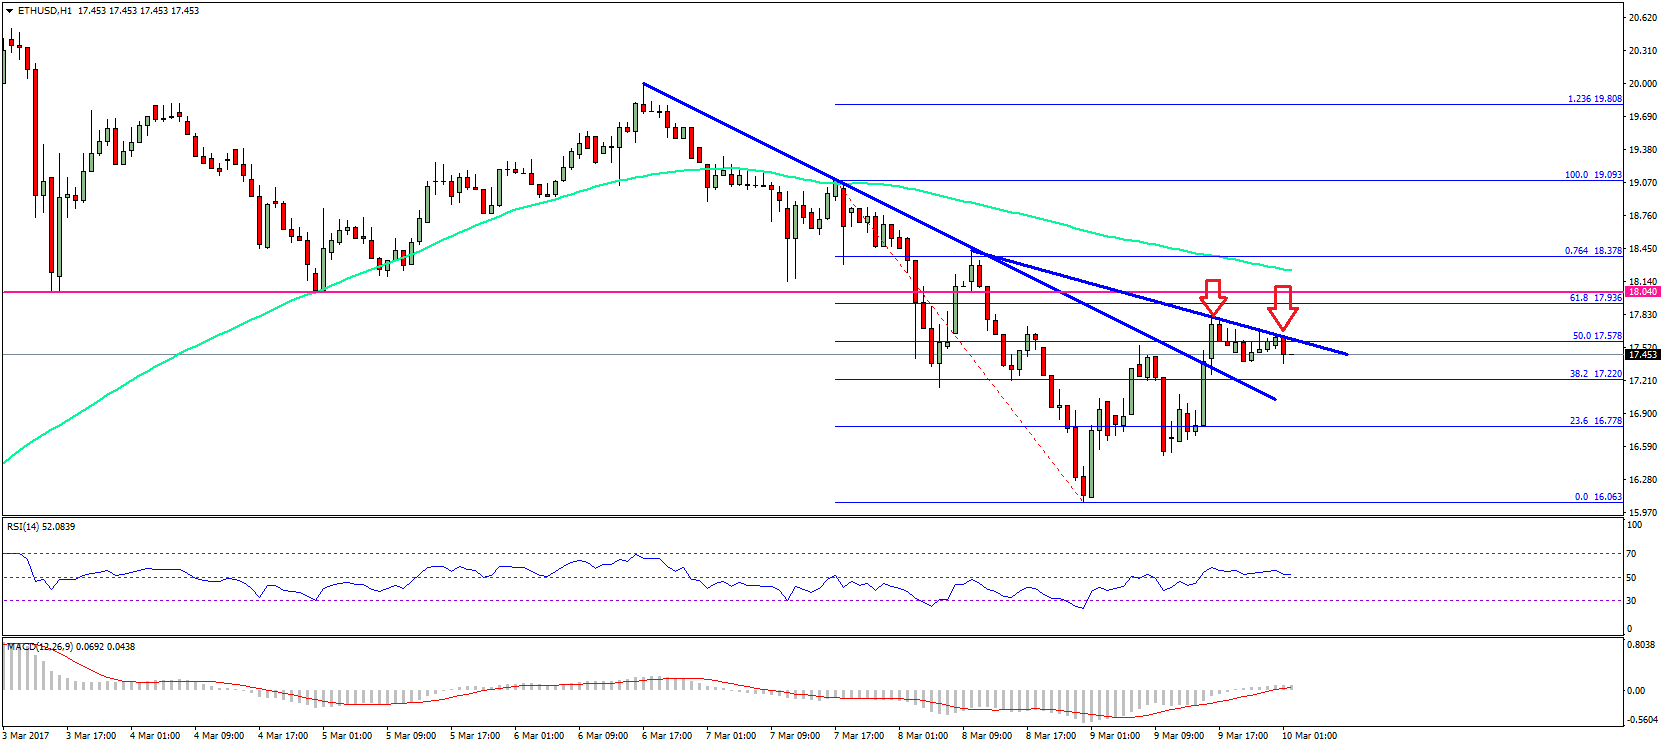
Furthermore, there is a new connecting bearish trend line formed with resistance at $17.65. So, it looks like the price is currently below an intermediate resistance around $17.65. On the upside, the next hurdle is near the 100 hourly simple moving average at $18.25. On the downside, the price may find support near $17.20, which was a resistance earlier.
Hourly MACD – The MACD has just moved into the bullish zone.
Hourly RSI – The RSI has recovered well, and now above the 50 level.
Major Support Level – $17.20
Major Resistance Level – $17.65
Charts courtesy – SimpleFX