Key Highlights
- After a sharp decline in ETH price towards the $80 handle against the US Dollar, a recovery started.
- A major bearish trend line with resistance at $87.90 on the hourly chart (ETH/USD, data feed via SimpleFX) was broken.
- The price is currently attempting a close above the 100 hourly simple moving average at $89.
Ethereum price managed to recover well from losses against the US Dollar and Bitcoin, and now ETH/USD is back in the bullish zone.
Ethereum Price Recovery
Yesterday, we saw a major decline in ETH price below $85 against the US Dollar. There was a sharp downside move and the price traded as low as $82.39. I mentioned that there is a chance of the price testing the 1.236 extension of the last wave from the $83.35 low to $93.49 high. It almost tested the same, traded as low as $82.39, and started a recovery. ETH/USD was successful in breaking the 38.2% Fib retracement level of the last decline from the $93.49 high to $82.39 low.
However, the most important break was above a major bearish trend line with resistance at $87.90 on the hourly chart of ETH/USD. At the moment, the price is attempting a close above the 100 hourly simple moving average at $89. Moreover, the 61.8% Fib retracement level of the last decline from the $93.49 high to $82.39 low is acting as a resistance and preventing further gains.
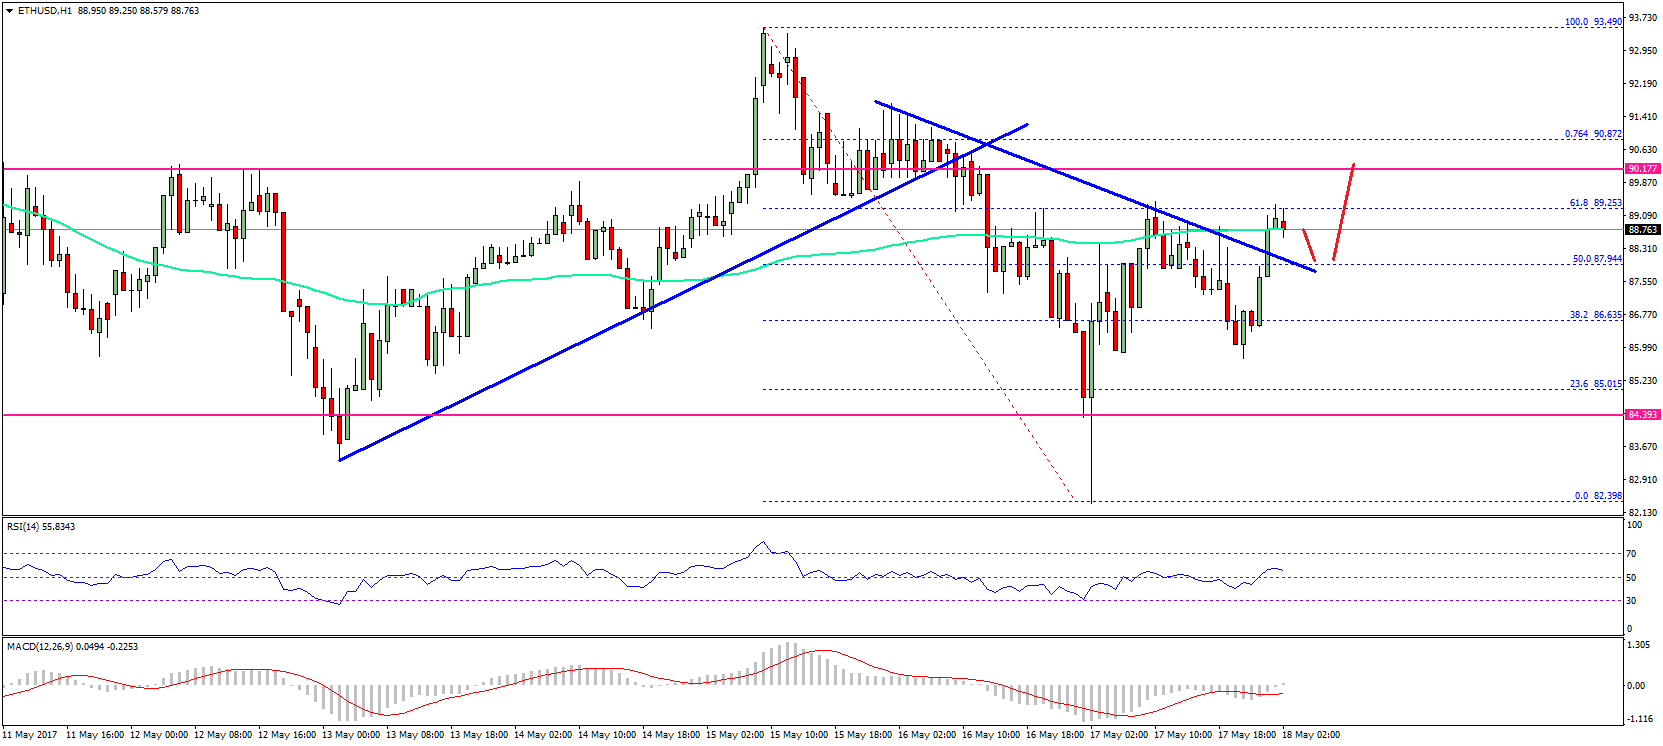
In my view, the price needs to close above the 100 hourly simple moving average and $90. If may find it difficult, so there can be a dip towards $87-85 before it makes another attempt. On the upside, the next major hurdle is near $90.87, which represents a swing high.
Hourly MACD – The MACD is attempting to move in the bullish zone.
Hourly RSI – The RSI has managed to move above the 50 level.
Major Support Level – $87.00
Major Resistance Level – $90.00
Charts courtesy – SimpleFX