Key Highlights
- ETH price failed badly to move past $309 against the US Dollar and started a new downside wave.
- There is a short-term bullish trend line with support at $288.50, holding losses on the hourly chart of ETH/USD (data feed via SimpleFX).
- The price might correct higher, but likely to decline further towards $280 in the near term.
Ethereum price is struggling to gain momentum against the US Dollar and Bitcoin. ETH/USD failed near $309 and is currently trading below $300.
Ethereum Price Resistance
Yesterday, we saw a decent rise in ETH price above the $300 level against the US Dollar. The price managed to move above $305 and traded close to the $310 level. A high was formed at $309.43 where buyers failed to push the price further higher. There were two attempts to take the price above $309.50, but sellers defended more gains successfully. As a result, a new downside wave was initiated and the price moved below the 38.2% Fib retracement level of the last wave from the $273.67 low to $309.43 high.
The price also moved below the $300 level and the 100 hourly simple moving average. It means the price once again moved back in the bearish zone below $300. At the moment, the price is trading below the 50% Fib retracement level of the last wave from the $273.67 low to $309.43 high. The ETH/USD pair is also attempting a close below a short-term bullish trend line with support at $288.50.
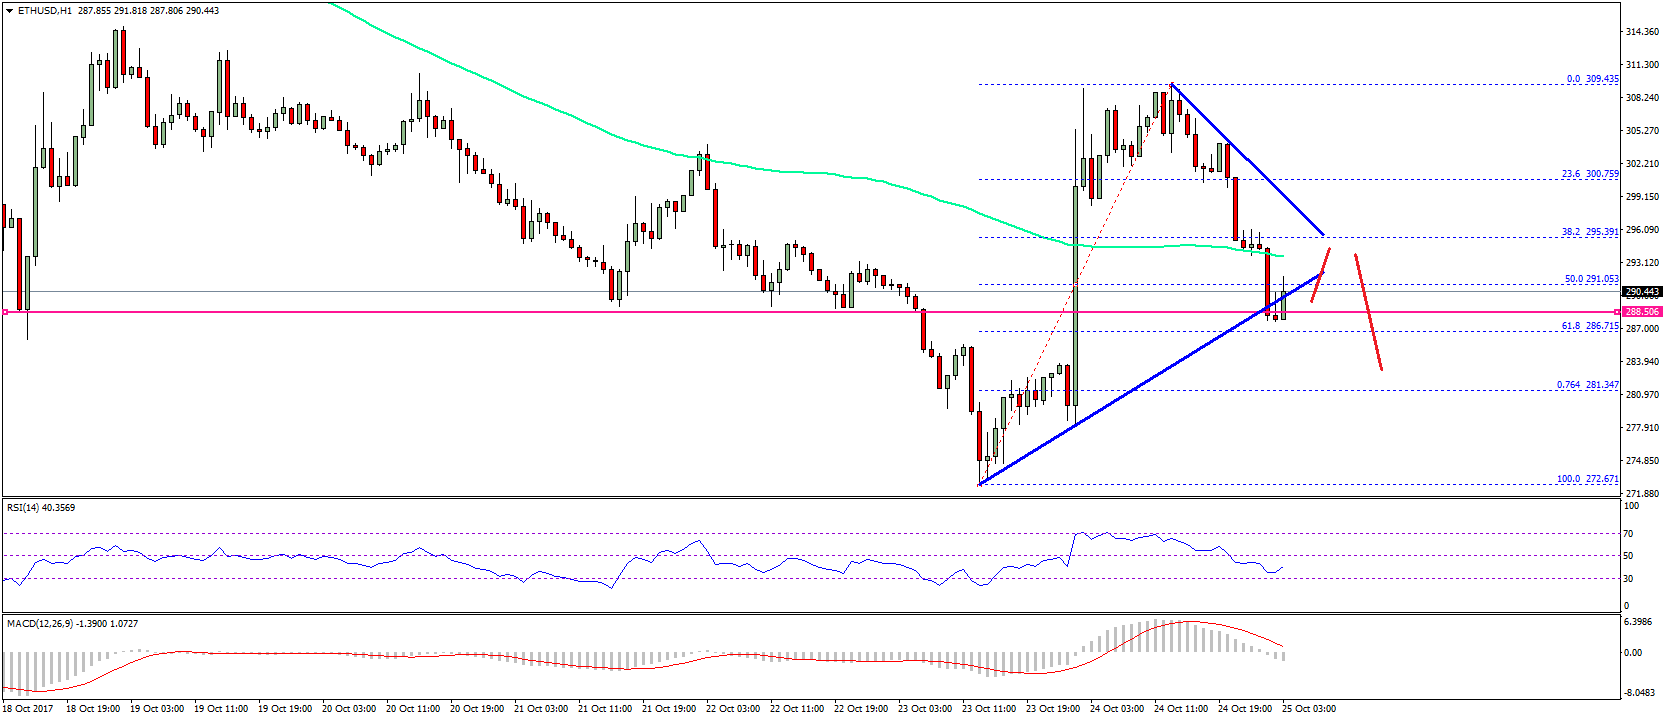
Once there is a close below $288.50, there are chances of more declines. On the upside, the 100 hourly SMA at $294 might act as a resistance. Moreover, there is a bearish trend line with resistance at $295.40. Overall, the price is back in the bearish zone and needs to move back above $296 to avoid any further declines.
Hourly MACD – The MACD has just moved into the bearish zone.
Hourly RSI – The RSI is currently well below the 50 level.
Major Support Level – $288
Major Resistance Level – $296
Charts courtesy – SimpleFX