Key Highlights
- ETH price recovered well after a monstrous collapse against the US Dollar to trade towards $11.50.
- The price failed to remain in the bullish trend, and currently moving lower.
- There is a short-term bullish trend line formed on the hourly chart (data feed via SimpleFX) of ETH/USD, which is acting as a support area.
Ethereum price after a decent recovery against the US Dollar started moving down. Does this mean a correction is over in ETH/USD?
Ethereum Price Support
ETH price managed to spike higher after trading as low as $9.23 against the US Dollar. The ETH/USD pair climbed higher and traded as high as $11.35, but it found sellers near the 200 hourly simple moving average, which acted as a barrier. The price is once again moving lower, and already traded below the 100 hourly simple moving average. Moreover, there was also a close below the 23.6% Fib retracement level of the last leg from the $9.23 low to $11.35 high.
So, this means the price may move further down. There are a few support levels on the downside. First, there is a short-term bullish trend line formed on the hourly chart (data feed via SimpleFX) of ETH/USD. Second, the 38.2% Fib retracement level of the last leg from the $9.23 low to $11.35 high is around the same trend line. Lastly, the $10.50 support area is crucial.
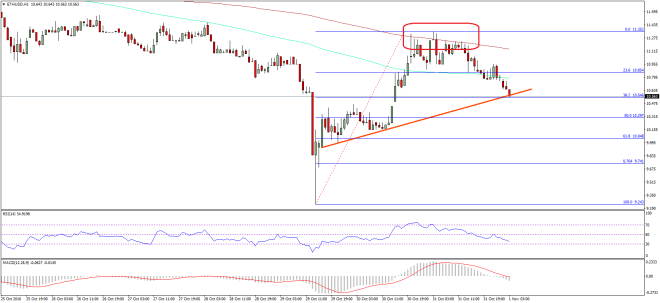

So, if the trend line acts as a perfect support, there is a chance of a bounce back. If there is a break below it, then the price may turn bearish once again. Let us see how it trades today, and whether it can bounce or not.
Hourly MACD – The MACD has changed the slope to the bearish zone.
Hourly RSI – The RSI is now below the 50 level, which is not a good sign for the buyers.
Major Support Level – $10.50
Major Resistance Level – $11.00
Charts courtesy – SimpleFX