Key Highlights
- There is a declining resistance formed in ETH price against the US Dollar, which is currently at $83.30.
- A contracting triangle pattern with support at $80.80 formed on the hourly chart (ETH/USD, data feed via SimpleFX).
- The price may soon either move above $83.30 or break $80.80 for more losses in the near term.
Ethereum price is slightly under pressure against the US Dollar and Bitcoin, and it looks like the ETH/USD pair is about to break a pattern for the next move.
Ethereum Price Resistance
In yesterday’s analysis, we saw how the $77 support prevented more declines in ETH price against the US Dollar. Later, the price recovered and was seen trading above the $80 handle. It also moved above the 50% Fib retracement level of the last decline from the $87.30 high to $76.93 low. It was a positive sign, but for some reason, the price was not above to move past $85, and now back lower.
The ETH/USD pair is currently trading inside a contracting triangle pattern with support at $80.80 formed on the hourly chart. On the upside, the triangle resistance is at $83.30. It also coincides with the 61.8% Fib retracement level of the last decline from the $87.30 high to $76.93 low. On the downside, the triangle support is just above $80.
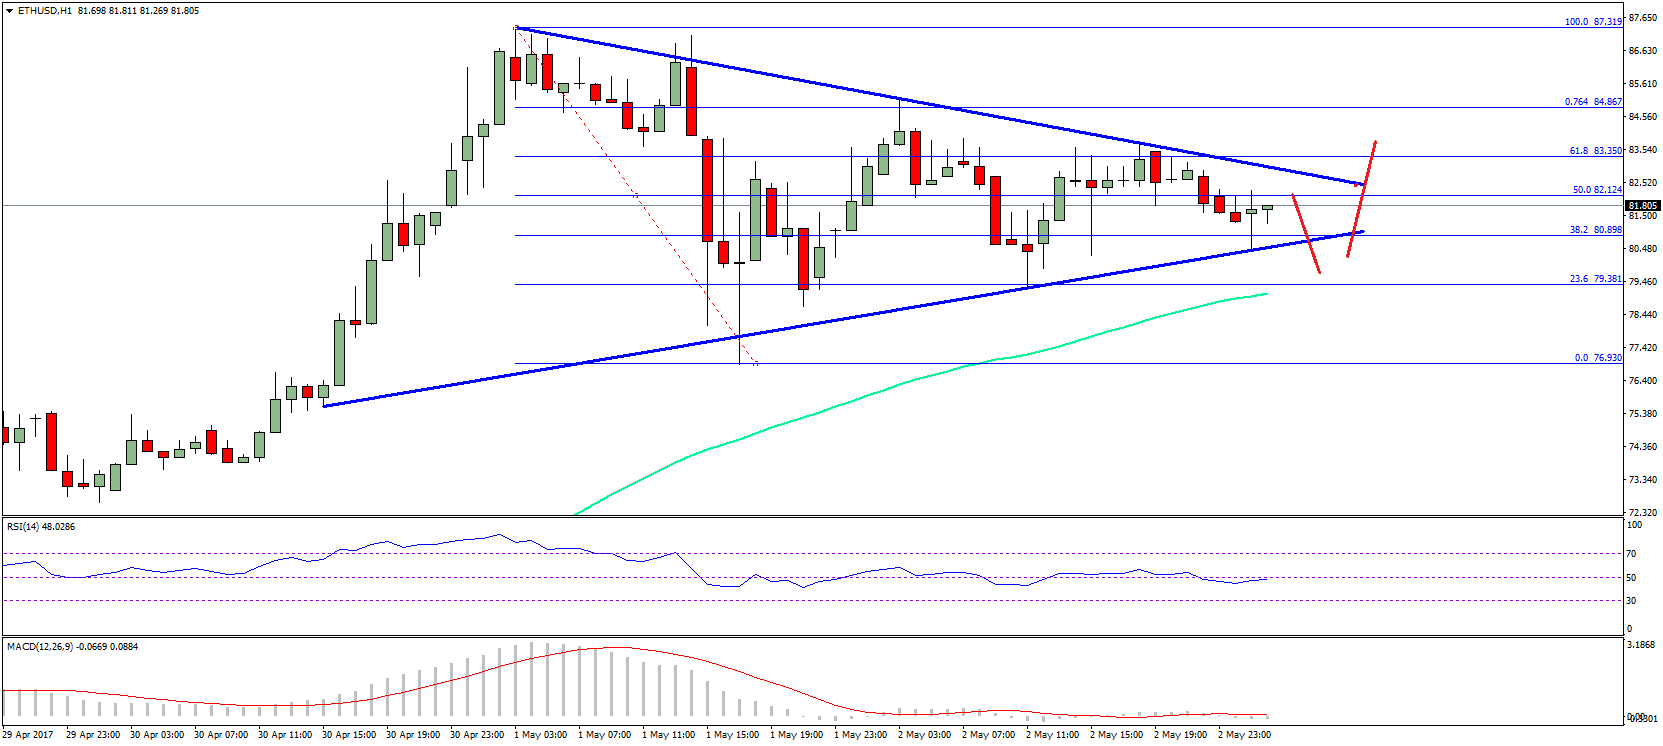
The best part is the fact that the 100 hourly simple moving average is at $79.30, waiting to provide support. So, if the price moves down, there are many supports around $80. On the upside, a break above $83.30 might call for a move towards the 76.4% Fib retracement level of the last decline from the $87.30 high to $76.93 low at $84.86. The most important resistance is the last swing high at $87.30.
Hourly MACD – The MACD is almost flat with no sign of a major move.
Hourly RSI – The RSI is currently just below the 50 level.
Major Support Level – $80.80
Major Resistance Level – $83.30
Charts courtesy – SimpleFX