Key Highlights
- It looks like ETH price is facing a major hurdle near $191.70 against the US Dollar, but may break it soon.
- There is a solid bullish trend line with support at $182 formed on the hourly chart (ETH/USD, data feed via SimpleFX).
- The price about to break the $192 resistance for further gains towards/above $200.
Ethereum price is gaining momentum against the US Dollar and Bitcoin, and now ETH/USD may soon break higher and set a new high towards/above $200.
Ethereum Price Trend Line Support
Yesterday, there was a decline towards $180 level in ETH price against the US Dollar. The price moved below the 23.6% Fib retracement level of the last wave from the $150.74 low to $191.70 high. However, the downside move can be considered as a correction, as the price recovered from $182. There was a decent buying interest around the $180 support zone, which pushed the price back higher.
Earlier, there was a test of the 38.2% Fib retracement level of the last wave from the $150.74 low to $191.70 high. So, we can say that the price completed a correction near $182, and about to break higher. On the downside, there is a solid bullish trend line with support at $182 formed on the hourly chart of ETH/USD. It may continue to act as a support and prevent downsides below $180.
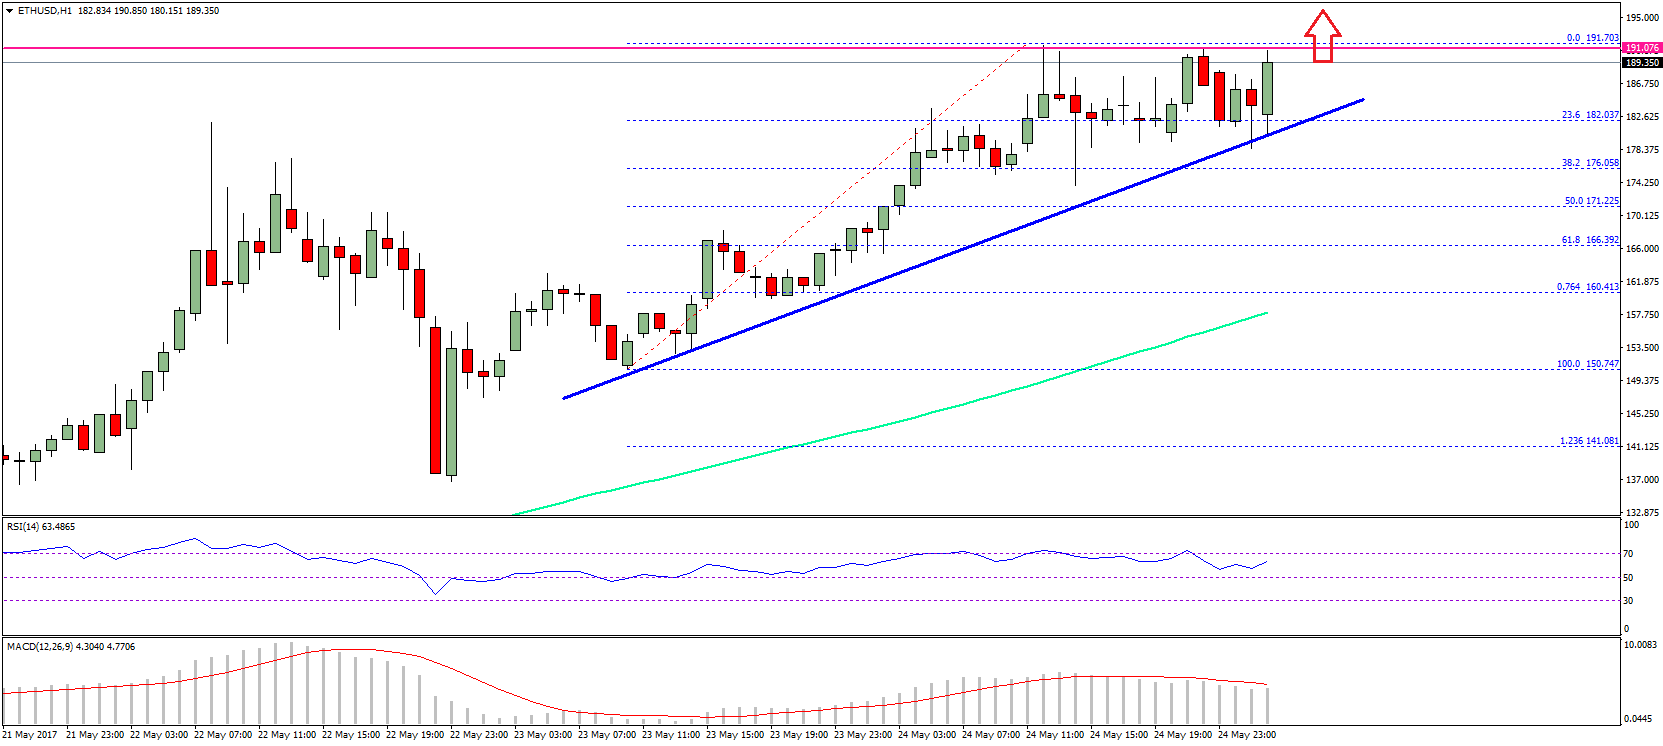
On the upside, a break above $191.00-191.50 is needed for further gains. The current candle is very bullish, and suggesting a break above $191.70 soon. A close may push the price towards $198-200, which is the next resistance. The overall trend is bullish and as long as the trend line and $180 are intact, the price may soon break higher above $192.
Hourly MACD – The MACD is placed well in the bullish zone.
Hourly RSI – The RSI is now moving higher, and remains well above the 50 level.
Major Support Level – $180.00
Major Resistance Level – $192.00
Charts courtesy – SimpleFX