Key Highlights
- ETH price made a sharp downside move against the US Dollar, and broke the $9.80 support zone.
- Yesterday’s highlighted connecting bullish trend line on the hourly chart (data feed via SimpleFX) of ETH/USD was cleared to open the gates for more declines.
- There was a sharp decline in Bitcoin price due to the PBOC investigation announcement, which caused a decline in ETH too.
Ethereum price collapsed against the US Dollar due to a sharp selling in BTC after the PBOC investigation announcement. More losses to follow in ETH/USD?
Ethereum Price Declines
ETH price was seen holding the $10.05 support area against the US Dollar yesterday, but it could not hold for long. There was a sharp selling initiated in BTC price due the PBOC investigation announcement. It took ETH price down as well against the US Dollar. During the downside move, the price broke a couple of important support levels. First, yesterday’s highlighted connecting bullish trend line on the hourly chart (data feed via SimpleFX) of ETH/USD was cleared.
Second, there was a break below the 50% Fib retracement level of the last wave from the $9.40 low to $10.66 high. Later, the price also cleared another bullish trend line on the same chart at $9.88. So, we can say that there was a clear break in ETH/USD. The price traded as low as $9.15, which was close to the 1.236 extension of the last wave from the $9.40 low to $10.66 high.
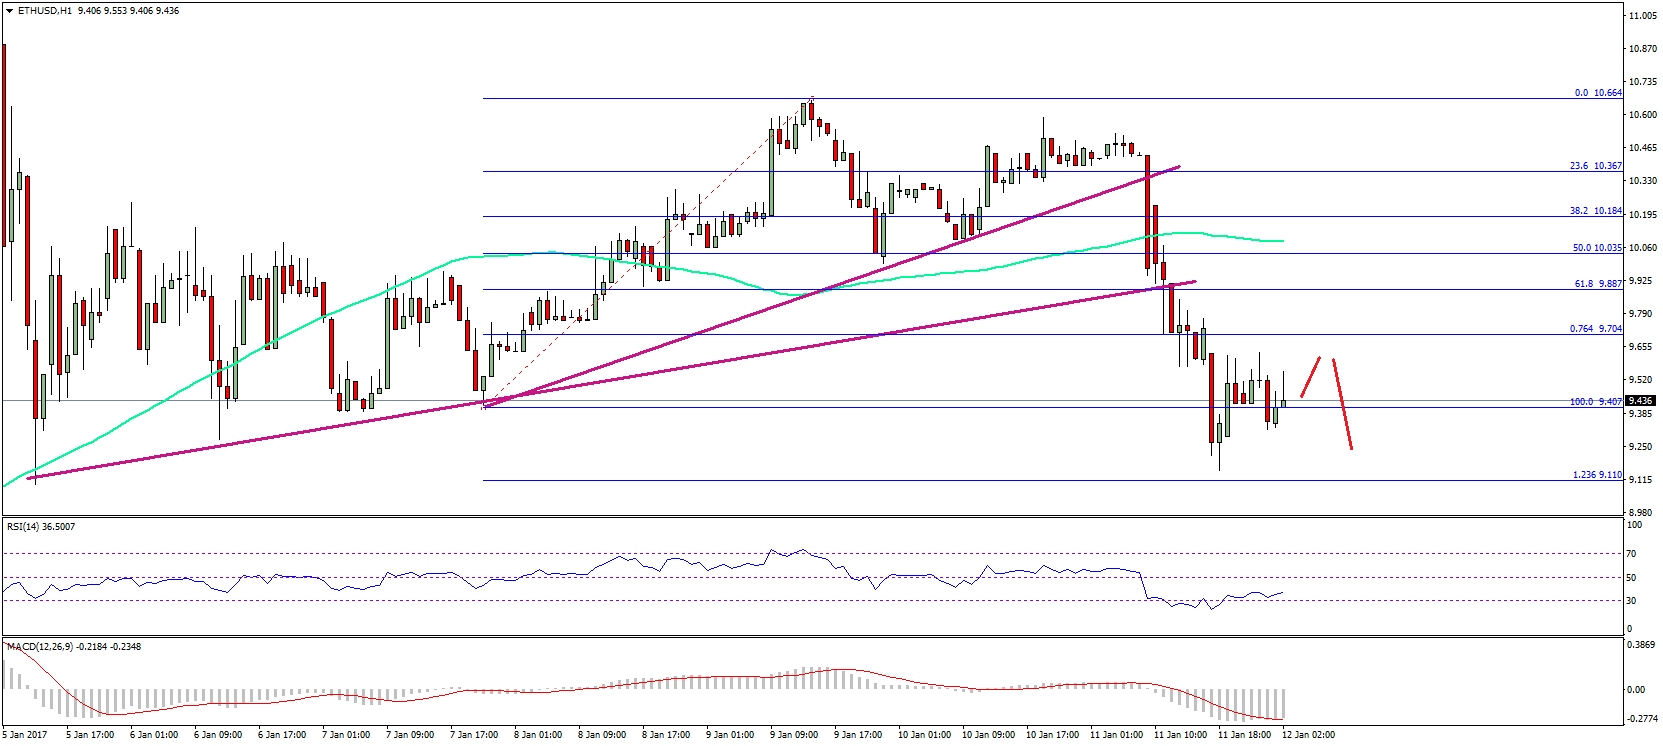
The price is currently recovering, but the upside move looks unstable and without momentum. The broken support area at $10.05 is now resistance. An initial resistance could be around the $9.88 level where sellers may appear.
Hourly MACD – The MACD is now well in the bearish slope, calling for more losses.
Hourly RSI – The RSI is recovering from the oversold reading.
Major Support Level – $9.20
Major Resistance Level – $9.88
Charts courtesy – SimpleFX