Key Highlights
- ETH price finally managed to overtake the $12.70-75 resistance against the US Dollar, and moved higher.
- Yesterday’s highlighted bearish trend line with resistance at $12.60 was broken on the hourly chart of ETH/USD (data feed via SimpleFX).
- The pair is currently correcting lower towards $12.75 where it may find support.
Ethereum price surged higher against the US Dollar, broke the $12.75 resistance, and ETH/USD moved towards $13.20 for further gains.
Ethereum Price Buy Dips?
Yesterday, we saw how there was a major resistance formed near $12.60 and $12.70 in ETH price against the US Dollar. Later, the ETH buyers finally managed to gain some pace, and pushed the price above $12.70. During the upside, the price broke many hurdles. First, yesterday’s highlighted bearish trend line at $12.60 was cleared on the hourly chart of ETH/USD (data feed via SimpleFX). Second, the price also broke the 100 hourly simple moving average at $12.60.
Finally, the most important break was near $12.75-77. The stated area acted as a monster barrier for ETH/USD earlier, and a break above it was crucial. It means the price is now following a nice bullish trend. It traded as high as $13.19 where it found resistance and moved down. It is currently correcting lower, and moved below the 23.6% Fib retracement level of the last wave from the $12.07 low to $13.19 high.
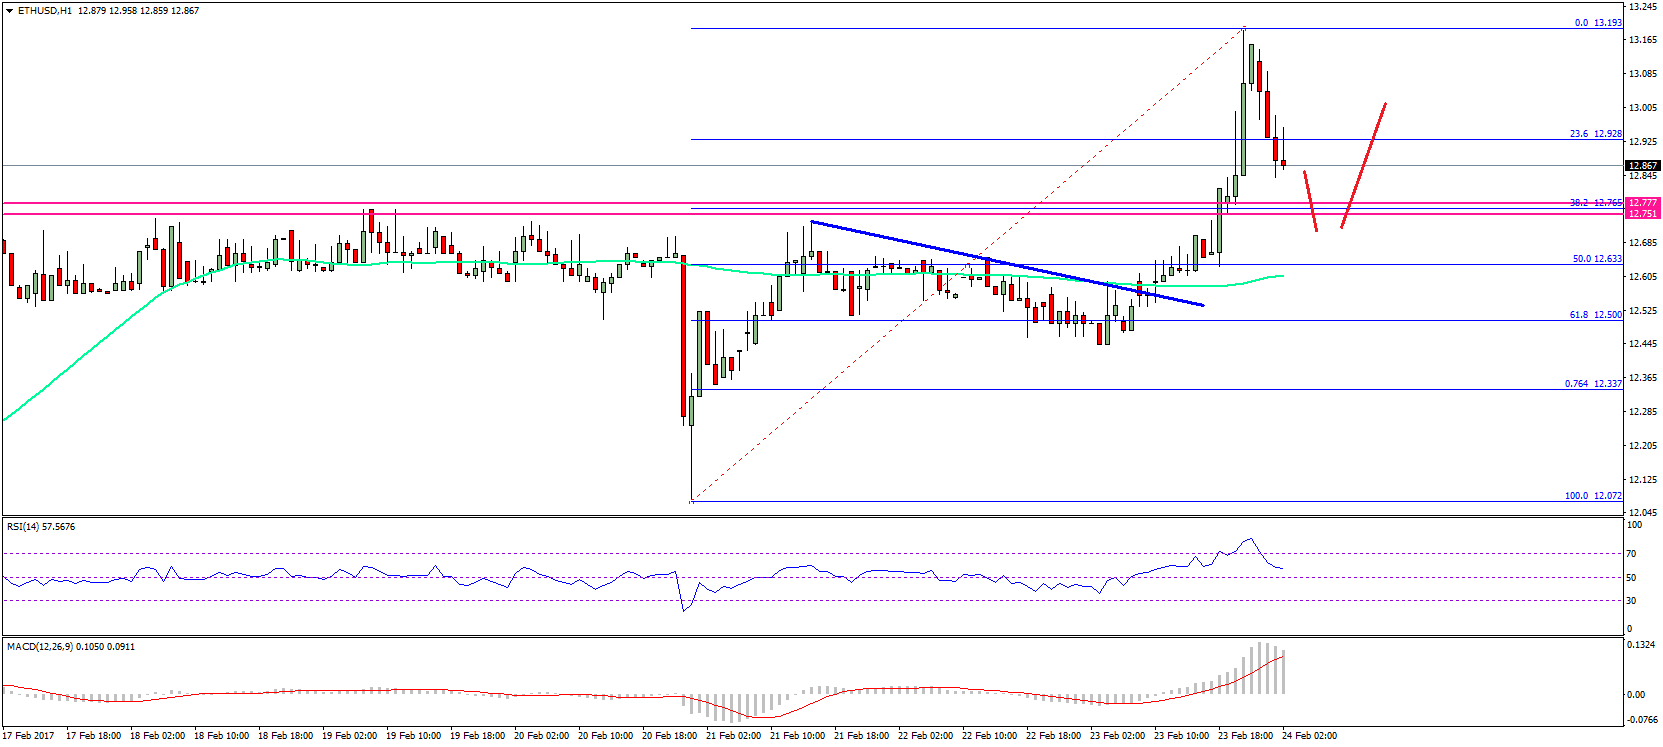
However, there is a major support area waiting on the downside at $12.75. The same level was resistance and now may act as a support. Moreover, it also coincides with the 38.2% Fib retracement level of the last wave from the $12.07 low to $13.19 high. So, buying dips near $12.75 may be considered as long as the price is above $12.70.
Hourly MACD – The MACD has moved into the bullish zone, which is a positive sign.
Hourly RSI – The RSI is correcting from the overbought levels, but still above the 50 level.
Major Support Level – $12.70
Major Resistance Level – $13.00
Charts courtesy – SimpleFX