Key Highlights
- ETH price failed to remain above the $296 support area against the US Dollar and moved down.
- There was a break below yesterday’s contracting triangle with support at $296 on the hourly chart of ETH/USD (data feed via SimpleFX).
- The price found bids near $286 and is currently correcting higher towards $295.
Ethereum price declined against the US Dollar and Bitcoin. ETH/USD broke $296 to move into the bearish zone in the short term.
Ethereum Price Support
Yesterday, we saw a breakout pattern formation for ETH price above $295 against the US Dollar. The price failed to remain in the positive zone and started a downside move below $301. There was a failure to break the 61.8% Fib retracement level of the last decline from the $302.60 high to $294.10 low. It opened the doors for a downside reaction and the price broke $298 and the 100 hourly simple moving average.
The downside move was such that there was a break below yesterday’s contracting triangle with support at $296 on the hourly chart of ETH/USD. The price even moved below the $292 support for a move below $290. The pair traded as low as $286.02 and is currently correcting higher. It has moved above the 23.6% Fib retracement level of the last decline from the $301.08 high to $286.02 low. However, there are many hurdles waiting on the upside near $294 and $295.
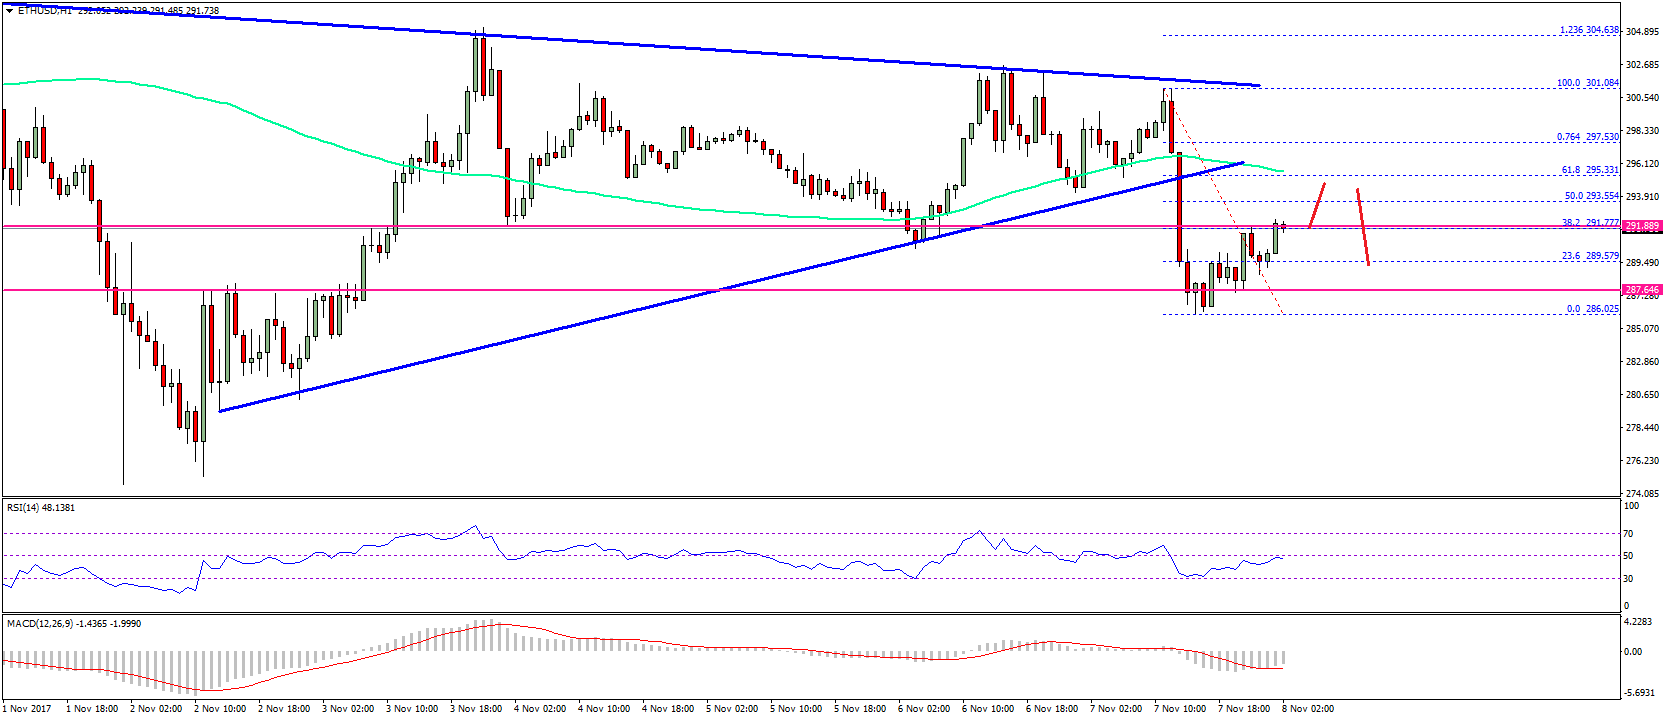
The 100 hourly SMA is at $295.10 to prevent upsides. The mentioned level also coincides with the 61.8% Fib retracement level of the last decline from the $301.08 high to $286.02 low. Therefore, if the price continues to move higher, it could face sellers near $295 and $296 in the short term.
Hourly MACD – The MACD is back in the bearish zone.
Hourly RSI – The RSI is moving higher back towards the 50 level.
Major Support Level – $286
Major Resistance Level – $296
Charts courtesy – SimpleFX