Key Highlights
- ETH price failed to move above the $295 level against the US Dollar and traded down.
- There was a break below yesterday’s highlighted bullish trend line with support at $291 on the hourly chart of ETH/USD (data feed via SimpleFX).
- There is now a new connecting bearish trend line forming with resistance near $290.50.
Ethereum price is again heading south against the US Dollar and Bitcoin. ETH/USD might correct further lower towards $282 in the near term.
Ethereum Price Resistance
Yesterday, there was an attempt to break the $295 resistance, but ETH price failed to gain pace against the US Dollar. The price traded as high as $295.83 and later started a downside move. During the downside, there was a break below yesterday’s highlighted bullish trend line with support at $291 on the hourly chart of ETH/USD. The pair also broke the 23.6% Fib retracement level of the last wave from the $274.62 low to $295.83 high.
The pair traded close to the $285 level where buyers emerged. The 50% Fib retracement level of the last wave from the $274.62 low to $295.83 high acted as a major barrier for sellers. The price recovered, but now there is a new connecting bearish trend line forming with resistance near $290.50. If the price corrects higher, it might find offers near $290. On the downside, the 100 hourly simple moving average is near $284.
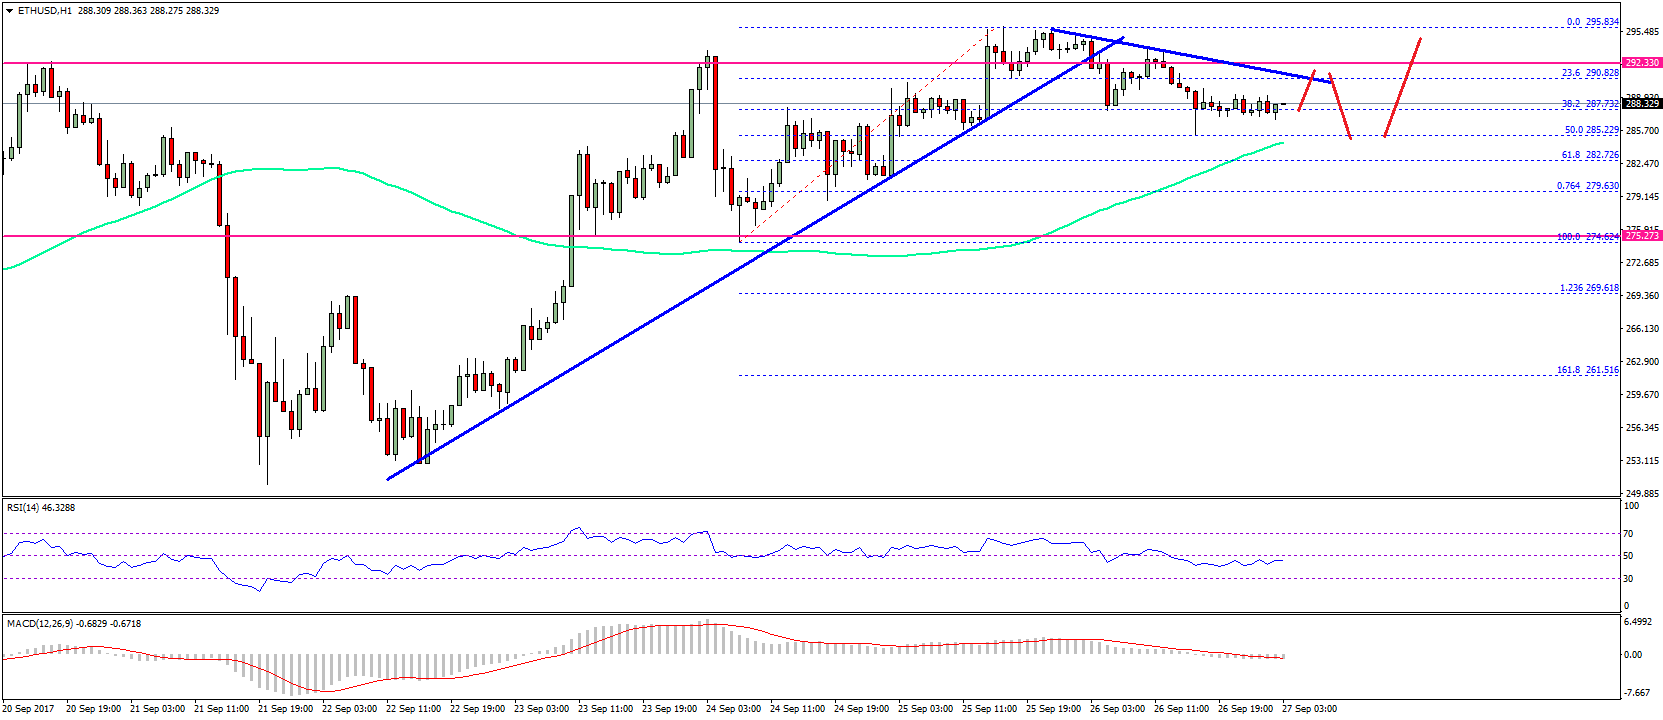
Moreover, the 61.8% Fib retracement level of the last wave from the $274.62 low to $295.83 high is at $282.72. Therefore, dips towards the $284-282 levels might find support. On the other hand, any upside move towards $290 could face resistance. The price needs to overcome the current range pattern to make the next move either below $282 or above $294-295.
Hourly MACD – The MACD is slightly in the bearish zone.
Hourly RSI – The RSI is currently below the 50 level.
Major Support Level – $282
Major Resistance Level – $290
Charts courtesy – SimpleFX