Key Highlights
- ETH price failed to gain traction against the US Dollar, and broke a short-term bullish trend.
- Yesterday’s highlighted connecting bullish trend line on the hourly chart (data feed via SimpleFX) of ETH/USD failed to hold the downside.
- The pair is approaching a major support area at $7.85 where buyers may appear.
Ethereum price failed to gain momentum against the US Dollar and Bitcoin. It looks like the ETH/USD is positioned for a test of $7.85.
Ethereum Price Downside Break
Yesterday, I was hoping for a minor bounce in ETH price versus the US Dollar. However, there was no major increase in the bullish momentum and buyers failed to hold the gains. As a result, there was a downside move, taking the price below the $8.10 support area. The most important point was the fact that yesterday’s highlighted connecting bullish trend line on the hourly chart (data feed via SimpleFX) of ETH/USD failed to hold the downside.
Moreover, the pair also broke the 61.8% Fib retracement level of the last wave from the $7.95 low to $8.43 high to clear the way for more downsides. The pair also broke the $8.10 support to trade as low as $7.90. The price is currently attempting a recovery, but may face sellers near a bearish trend line formed on the same chart. Moreover, the 23.6% Fib retracement level of the last decline from the $8.43 high to $7.90 low may also act as a resistance.
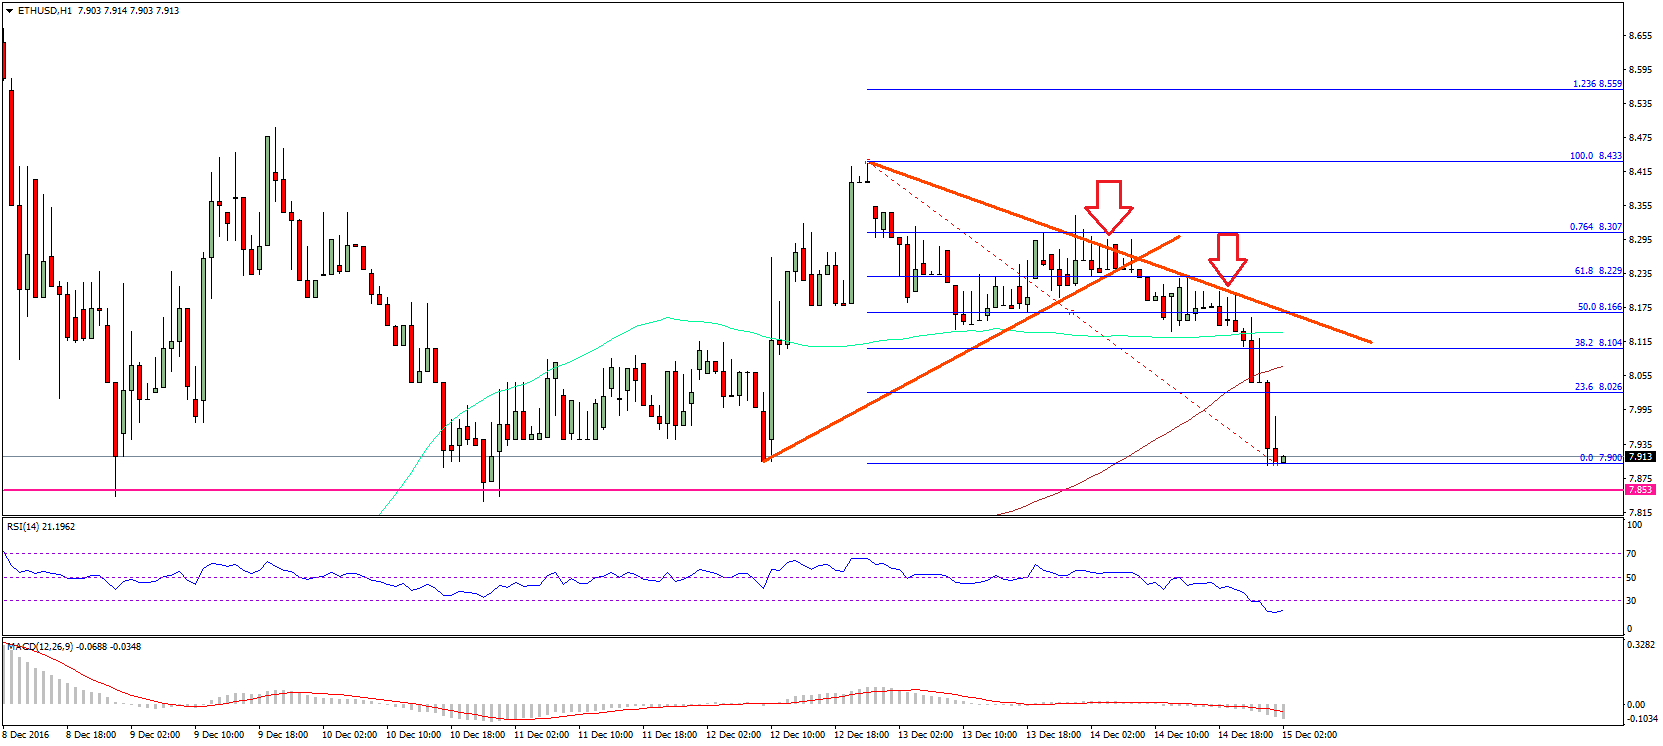
So, if the ETH/USD attempts to correct higher, then it may face sellers near $8.02 and $8.10. The trend line resistance is the most important hurdle for a change in the trend. On the downside, the $7.85 is a monster support area.
Hourly MACD – The MACD has changed the slope from bullish to bearish.
Hourly RSI – The RSI is currently around the oversold readings, so there can be a minor correction.
Major Support Level – $7.85
Major Resistance Level – $8.10
Charts courtesy – SimpleFX